Design a Data & AI Stack for Your Constraints
Turn your architecture, cloud, budget, deployment, scale, team, and workload requirements into an explainable stack recommendation.
How recommendations are scoredYour Open Lakehouse
Click any tool to swap it. Add optional layers to customize your recommendation.
Why this recommendation
Evidence: Low · 45/100This reflects how much supporting evidence we have for the recommendation, based on source coverage, metadata, and verified integrations.
- Optimized for a default open lakehouse architecture across the required stack layers.
- Balances role fit, your stated requirements, and available integration evidence.
- Public activity is not part of Fit. It only separates candidates that fit equally well and are equally well evidenced.
- Source coverage: Selected tools have usable source coverage, with some gaps in adoption, reviews, or metadata.
- Verified integrations: 0 of 2 required integrations are verified. No verified integration found yet: Amazon Athena + Delta Lake and Coalesce + Amazon Athena.
- Requirement evidence: No optional requirements were selected, so the stack is judged on default architecture fit.
Integration Map
Scroll horizontally to inspect every stack connection.
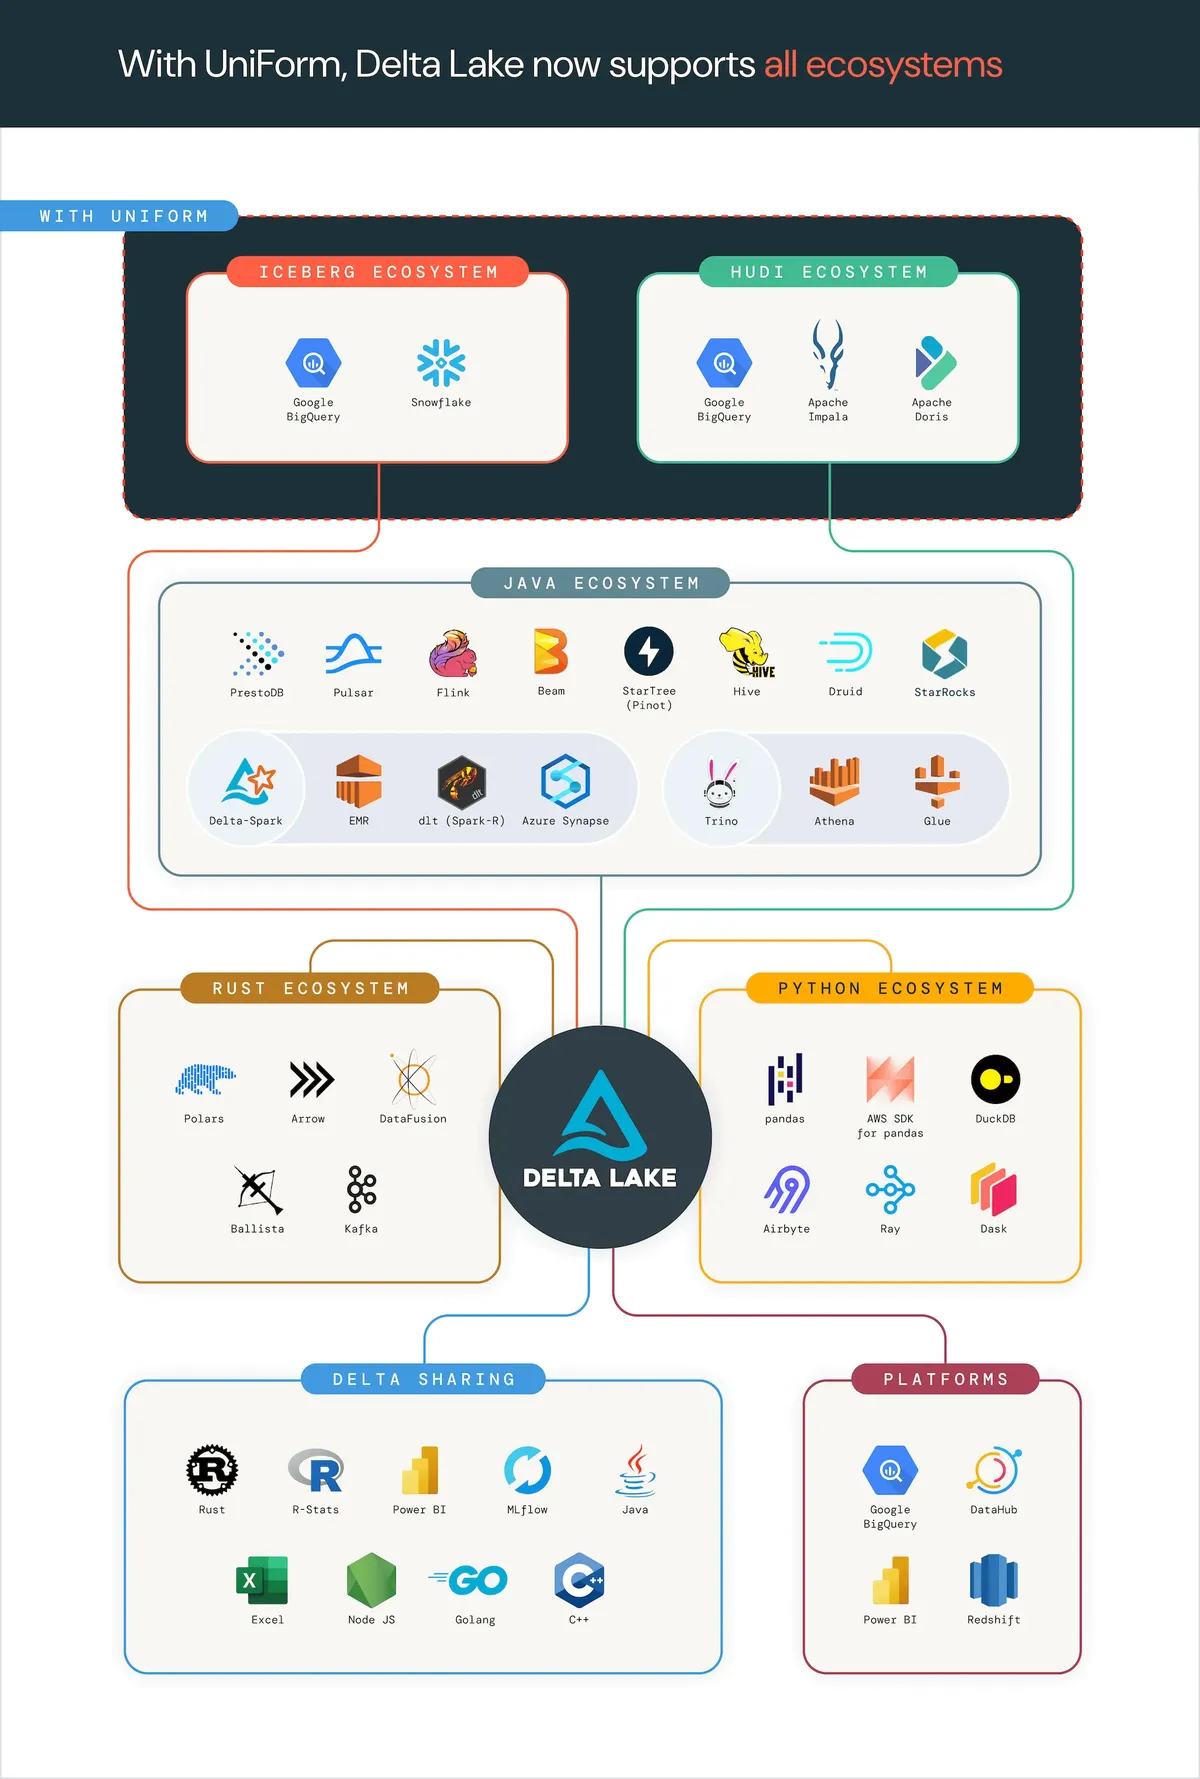
No verified integrations
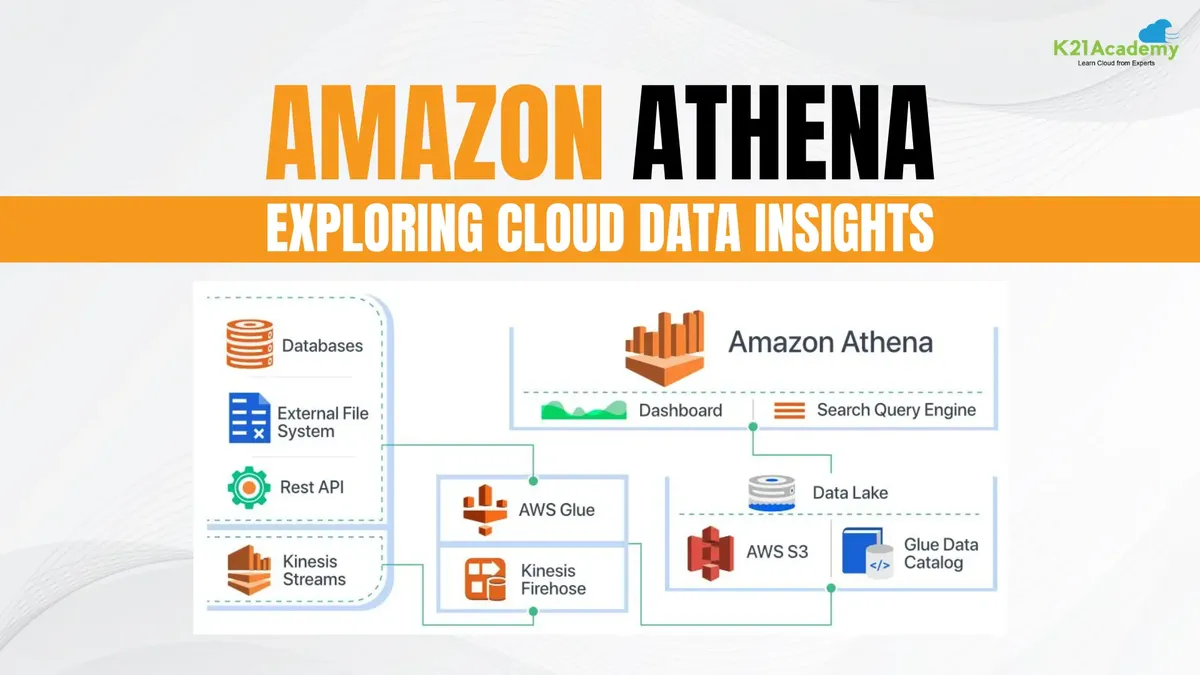
2 of 2 required relationships have no recorded answer either way.
No verified integrations
1 of 1 required relationships have no recorded answer either way.
Understanding your stack scores
How well a tool matches the requirements you stated — role and capability, your workload and team, the rest of the stack, how and where you run it, and cost. It is a range wherever we hold no evidence either way, and the ranking uses the low end. Public activity is not part of it.
How much of the answer rests on evidence we hold, separately from how good the answer is. A high-fit tool with low evidence may well be right; we cannot show it from what we have recorded.
The average fit of the layers in this stack, with the weakest layer named beside it — that is the layer a stack actually fails at, and an average alone hides it.
How much of the architecture this stack covers. Reported separately from fit because the two fail differently: four excellent layers out of five and five layers with one poor one are both partly right, and they call for different next steps.
Share of architecture-relevant stack connections with a verified integration, shown out of 100. Green lines are verified integrations; amber dashed lines are expected stack connections where verified source evidence is not recorded yet.
Estimated range based on each tool's published starting price and pricing model. Actual costs depend on usage, team size, and plan tier.
Integration indicators on each tool
A solid architecture
This stack has a few moving parts. We can help you avoid common integration pitfalls and get to production faster.
Book a Discovery Call →