Decision comparison
Coralogix vs Dynatrace
Coralogix and Dynatrace optimise for different problems. Coralogix processes telemetry in a streaming pipeline so cost follows what you query rather than everything you send. Dynatrace deploys OneAgent across an estate, discovers the topology itself, and uses Davis AI to propose a root cause rather than leaving an engineer to correlate one.
Direct comparison. These are reviewed substitutes bought for the same job, so the differences below are the ones that decide between them.
Applies to: Choosing between these two for the apm observability decision.
All 2 are observability platforms.
Quick Comparison
| Decision factor | Coralogix | Dynatrace |
|---|---|---|
| What it is | An observability platform that processes telemetry in a streaming pipeline, so cost follows what you query rather than everything you send | An enterprise observability platform with OneAgent auto-instrumentation and the Davis AI engine for root-cause analysis |
| Emphasis | Telemetry economics: what is indexed, what is archived, and what that costs | Automated analysis: discover the topology, then propose the cause |
| Instrumentation | OpenTelemetry and standard shippers, with processing applied in flight | OneAgent deployed once per host, discovering processes and dependencies automatically |
| Analysis | Search, dashboards and alerting over processed telemetry | Davis AI proposes a root cause from the discovered topology |
| Data handling | Low-value telemetry archived cheaply and still reachable | Telemetry collected and retained by the platform on plan terms |
| Scope | Logs, metrics, traces and security analytics | Applications, infrastructure, logs, real user monitoring and security |
| Best fit | High volume where the queried fraction is small and the bill is the problem | Large estates where keeping a map current is itself the problem |
| Instrumentation path | OpenTelemetry SDKs in Python, Java, Node.js or Go emitting OTLP, or the platform's own agent | OpenTelemetry SDKs in Python, Java, Node.js or Go emitting OTLP, or the platform's own agent |
Coralogix
- What it is:
- An observability platform that processes telemetry in a streaming pipeline, so cost follows what you query rather than everything you send
- Emphasis:
- Telemetry economics: what is indexed, what is archived, and what that costs
- Instrumentation:
- OpenTelemetry and standard shippers, with processing applied in flight
- Analysis:
- Search, dashboards and alerting over processed telemetry
- Data handling:
- Low-value telemetry archived cheaply and still reachable
- Scope:
- Logs, metrics, traces and security analytics
- Best fit:
- High volume where the queried fraction is small and the bill is the problem
- Instrumentation path:
- OpenTelemetry SDKs in Python, Java, Node.js or Go emitting OTLP, or the platform's own agent
Dynatrace
- What it is:
- An enterprise observability platform with OneAgent auto-instrumentation and the Davis AI engine for root-cause analysis
- Emphasis:
- Automated analysis: discover the topology, then propose the cause
- Instrumentation:
- OneAgent deployed once per host, discovering processes and dependencies automatically
- Analysis:
- Davis AI proposes a root cause from the discovered topology
- Data handling:
- Telemetry collected and retained by the platform on plan terms
- Scope:
- Applications, infrastructure, logs, real user monitoring and security
- Best fit:
- Large estates where keeping a map current is itself the problem
- Instrumentation path:
- OpenTelemetry SDKs in Python, Java, Node.js or Go emitting OTLP, or the platform's own agent
Public signals
Verified factual signals only. Bars appear only for like-for-like metrics with five weekly assessments for every tool; missing evidence stays explicit. These signals do not establish enterprise adoption, product quality, or total cost.
| Metric | Coralogix | Dynatrace |
|---|---|---|
| GitHub commits, 90d(Developer adoption) | 108 | 275 |
| GitHub stars(Developer adoption) | 22 | 220 |
| Search interest(Market interest) | 0 | 4 |
| Hacker News mentions, 90d(Community interest) | 0 | 4 |
| npm weekly downloads(Developer adoption) | 90.9k | Not available |
| PyPI weekly downloads(Developer adoption) | 110.0k | 20.2k |
| Stack Overflow questions(Community interest) | 1 | 199 |
As of September 14, 2026 — updated weekly.
Health & risk evidence
Observed public-source checks for mapped package versions and repositories.
Coralogix
September 14, 2026Package vulnerabilities
npm · @coralogix/browser@3.23.6 · PyPI · coralogix-logger@2.1.1
0 vulnerabilities
across 2 packages
Repository security score
Not available
Dynatrace
September 14, 2026Package vulnerabilities
PyPI · oneagent-sdk@1.5.2.20260107.153442
0 vulnerabilities
across 1 package
Repository security score
Not available
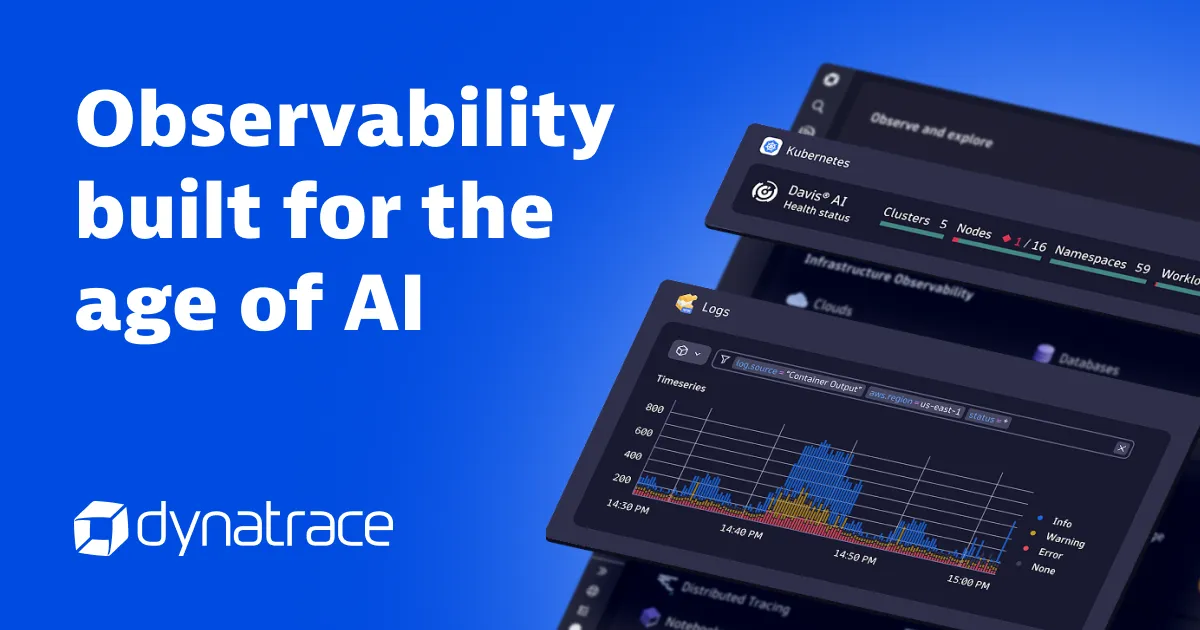
Interface Preview
Coralogix

Dynatrace
Feature Comparison
| Feature | Coralogix | Dynatrace |
|---|---|---|
| Analysis | ||
| Automatic topology discovery | Partial support | Full support |
| Proposed root cause | Not verified | Full support |
| Real user monitoring | Partial support | Full support |
| Code-level diagnostics | Partial support | Full support |
| Telemetry economics | ||
| Processing applied before indexing | Full support | Partial support |
| Archive that stays queryable | Full support | Partial support |
| Per-source retention control | Full support | Partial support |
| Cost tied to usage rather than ingestion | Full support | Not verified |
| Platform | ||
| Security monitoring | Full support | Full support |
| Archive in your own storage | Full support | Not verified |
| Enterprise access control | Full support | Full support |
| Large-estate coverage | Partial support | Full support |
| Standards | ||
| OpenTelemetry ingestion | Full support | Full support |
| Distributed tracing | Full support | Full support |
| Log search | Full support | Full support |
| Metrics dashboards and alerting | Full support | Full support |
Analysis
Automatic topology discovery
Proposed root cause
Real user monitoring
Code-level diagnostics
Telemetry economics
Processing applied before indexing
Archive that stays queryable
Per-source retention control
Cost tied to usage rather than ingestion
Platform
Security monitoring
Archive in your own storage
Enterprise access control
Large-estate coverage
Standards
OpenTelemetry ingestion
Distributed tracing
Log search
Metrics dashboards and alerting
Which to choose
Coralogix and Dynatrace optimise for different problems. Coralogix processes telemetry in a streaming pipeline so cost follows what you query rather than everything you send. Dynatrace deploys OneAgent across an estate, discovers the topology itself, and uses Davis AI to propose a root cause rather than leaving an engineer to correlate one.
Best-fit scenarios
Choose Coralogix if:
Choose Coralogix when the observability bill is the problem. Processing in flight means low-value telemetry is archived rather than indexed and stays reachable rather than deleted, retention is decided per source, and the archive can live in storage you control. That matters most where volume is high and the queried fraction is small.
Choose Dynatrace if:
Choose Dynatrace when the estate is large enough that nobody can hold it in their head. OneAgent discovers processes and dependencies so the map stays current without maintenance, Davis AI proposes a cause instead of presenting a dashboard, and real user monitoring and security sit in the same platform.
These scenarios reflect the available product evidence. Your requirements, existing stack, and team expertise should guide the final decision.
Frequently Asked Questions
Is a proposed root cause trustworthy?
It is a strong first hypothesis rather than an answer, and that is still valuable at 3am. An engine that knows the topology can say which component changed behaviour first and what depends on it, narrowing an investigation from an estate to a service. Keep the ability to disagree with it: a confident wrong answer costs more than no answer.
Can we control cost on an agent-priced platform?
Partly. Agent or host pricing is predictable in a way ingestion pricing is not, because it scales with infrastructure rather than with how enthusiastically engineers log. What it does not give you is the option to keep cheap data cheaply: retention is a plan tier rather than a per-source decision. Which model suits you depends on whether your infrastructure or your log volume is growing faster.
What do these need to run?
An agent or an OpenTelemetry SDK in the application, and a destination. Services in Python, Java, Node.js or Go emit OTLP over HTTP or gRPC, and containers on Kubernetes are instrumented once per pod or once per node depending on the collector you choose. Nothing unusual is required on the application side; the operational weight sits in deciding what to sample, what to retain and for how long.
How portable is the instrumentation?
Both ingest OpenTelemetry, so instrumentation written as OTLP transfers either way. The difference is what sits on top. Dynatrace's OneAgent produces the automatic discovery and continuous topology that Davis reasons over, and none of that comes from standard instrumentation or moves with it. Coralogix's equivalent non-portable asset is the tiering policy — which streams are indexed, monitored or archived — built up over months. Instrument with OpenTelemetry, and treat both the agent topology and the tiering policy as deliberate dependencies.
What actually drives the cost on each?
On Coralogix, data volume multiplied by the tier assigned — indexed, monitoring-only, or archived to object storage you own — with classification as the lever that has to be kept current. On Dynatrace, several meters at once: hosts monitored, data ingested, data retained, and analysis run over it, with ingest separated from query so rarely-searched data is cheaper to keep. One asks you to classify telemetry, the other asks you to manage several dials. Both punish inattention, in different currencies.
Who is each one for?
Dynatrace suits an estate large enough that nobody holds the architecture in their head, where the valuable property is a platform that discovers dependencies and proposes a cause across them. Coralogix suits an organisation whose telemetry volume has outgrown the budget and which is willing to classify data rather than index all of it. The separating question is which sentence appears in your postmortems: "we did not know those services were connected", or "we did not keep the logs that would have shown it".
How should we evaluate them?
Send a slice of real traffic to both and then debug a real incident on each. Dashboards demo well and tell you very little; what matters is whether an engineer at 3am can go from an alert to the cause without knowing in advance which dashboard to open. OpenTelemetry makes that trial cheap, because the instrumentation is the same and only the destination changes.