Decision comparison
Amazon CloudWatch vs Datadog
Choose Amazon CloudWatch when AWS-native operation, cross-account visibility, Container Insights, and managed AWS integration are the primary requirements. Choose Datadog when a team needs a broad SaaS observability suite spanning APM, log management, network monitoring, synthetic monitoring, and real-user monitoring across cloud environments.
Architecture choice. These take different approaches to the same problem. Read the table as a fit question rather than a feature race.
Applies to: Whether the cloud provider's own monitoring is enough, or a third-party platform is needed.
These are different kinds of product — Cloud-Native Monitoring and Observability Platform.
Quick Comparison
| Decision factor | Amazon CloudWatch | Datadog |
|---|---|---|
| Best For | AWS-centric teams needing managed infrastructure, application, container, logs, metrics, and cross-account operational visibility within their existing AWS environment. | Teams operating modern applications across clouds that need SaaS-based logs, APM, network monitoring, user-experience monitoring, tagging, and service-level troubleshooting. |
| Architecture | AWS-native managed observability service combining dashboards, alarms, logs, metrics, Application Insights, Container Insights, metric streaming, and OpenTelemetry integration. | SaaS observability platform using Datadog Agent telemetry collection, unified metrics, logs, traces, APM, network monitoring, synthetic monitoring, and real-user monitoring. |
| Pricing Model | Free tier with published allowances: 10 custom or detailed-monitoring metrics, 1 million API requests (excluding GetMetricData, GetInsightRuleReport and GetMetricWidgetImage, which are always charged), 5 GB of Logs data, 3 custom dashboards, 10 alarm metrics and 1,800 Live Tail minutes per month. Paid usage is billed per unit, not by monthly plan: OpenTelemetry metric ingestion at $0.50 per GB including 15 months of storage, PromQL queries at $0.01 per million samples scanned, PutMetricData at $0.01 per million requests on top of metric storage, Live Tail at $0.01 per minute past the free allowance, metric centralization at $0.05 per GB after the first copy, and Database Insights Advanced mode at $0.0125 per vCPU-hour. Classic custom metrics are tiered at $0.30 per metric for the first 10,000, $0.10 for the next 240,000 and $0.05 beyond 250,000, which AWS states only inside its worked examples. Cross-account observability carries no additional charge. AWS states no up-front commitment and no minimum fee. Rates are US East (N. Virginia) and vary by region. | Free tier available, paid plans start at $0.75 per host per month, additional costs based on usage and features |
| Ease of Use | Convenient for AWS workloads through native managed services and unified dashboards, though cross-account configuration and usage-based billing require deliberate operational setup. | Auto-generated service overviews and correlated telemetry aid investigation, but users report setup complexity, a learning curve, and desire for a simpler interface. |
| Scalability | Built to observe and optimize workloads at scale, including cross-account environments, containerized applications, high-resolution alarms, and real-time metric streaming. | Designed for applications at scale across clouds, applications, and devices; metered hosts, logs, metrics, and features require active cost governance. |
| Community/Support | AWS-supported managed service; its CloudWatch Agent repository has 550 GitHub stars, uses Go, is MIT-licensed, and released v1.300071.0 recently. | User feedback reports an 8.6/10 rating across 346 reviews; Datadog Agent has 3,713 GitHub stars and Apache-2.0 licensing. |
Amazon CloudWatch
- Best For:
- AWS-centric teams needing managed infrastructure, application, container, logs, metrics, and cross-account operational visibility within their existing AWS environment.
- Architecture:
- AWS-native managed observability service combining dashboards, alarms, logs, metrics, Application Insights, Container Insights, metric streaming, and OpenTelemetry integration.
- Pricing Model:
- Free tier with published allowances: 10 custom or detailed-monitoring metrics, 1 million API requests (excluding GetMetricData, GetInsightRuleReport and GetMetricWidgetImage, which are always charged), 5 GB of Logs data, 3 custom dashboards, 10 alarm metrics and 1,800 Live Tail minutes per month. Paid usage is billed per unit, not by monthly plan: OpenTelemetry metric ingestion at $0.50 per GB including 15 months of storage, PromQL queries at $0.01 per million samples scanned, PutMetricData at $0.01 per million requests on top of metric storage, Live Tail at $0.01 per minute past the free allowance, metric centralization at $0.05 per GB after the first copy, and Database Insights Advanced mode at $0.0125 per vCPU-hour. Classic custom metrics are tiered at $0.30 per metric for the first 10,000, $0.10 for the next 240,000 and $0.05 beyond 250,000, which AWS states only inside its worked examples. Cross-account observability carries no additional charge. AWS states no up-front commitment and no minimum fee. Rates are US East (N. Virginia) and vary by region.
- Ease of Use:
- Convenient for AWS workloads through native managed services and unified dashboards, though cross-account configuration and usage-based billing require deliberate operational setup.
- Scalability:
- Built to observe and optimize workloads at scale, including cross-account environments, containerized applications, high-resolution alarms, and real-time metric streaming.
- Community/Support:
- AWS-supported managed service; its CloudWatch Agent repository has 550 GitHub stars, uses Go, is MIT-licensed, and released v1.300071.0 recently.
Datadog
- Best For:
- Teams operating modern applications across clouds that need SaaS-based logs, APM, network monitoring, user-experience monitoring, tagging, and service-level troubleshooting.
- Architecture:
- SaaS observability platform using Datadog Agent telemetry collection, unified metrics, logs, traces, APM, network monitoring, synthetic monitoring, and real-user monitoring.
- Pricing Model:
- Free tier available, paid plans start at $0.75 per host per month, additional costs based on usage and features
- Ease of Use:
- Auto-generated service overviews and correlated telemetry aid investigation, but users report setup complexity, a learning curve, and desire for a simpler interface.
- Scalability:
- Designed for applications at scale across clouds, applications, and devices; metered hosts, logs, metrics, and features require active cost governance.
- Community/Support:
- User feedback reports an 8.6/10 rating across 346 reviews; Datadog Agent has 3,713 GitHub stars and Apache-2.0 licensing.
Public signals
Verified factual signals only. Bars appear only for like-for-like metrics with five weekly assessments for every tool; missing evidence stays explicit. These signals do not establish enterprise adoption, product quality, or total cost.
| Metric | Amazon CloudWatch | Datadog |
|---|---|---|
| GitHub commits, 90d(Developer adoption) | 68 | 2.4k |
| GitHub stars(Developer adoption) | 550 | 3,500+ |
| Search interest(Market interest) | 1 | 14 |
| Hacker News mentions, 90d(Community interest) | 2 | 16 |
| npm weekly downloads(Developer adoption) | 179.5k | 7.3M |
| Stack Overflow questions(Community interest) | 4.2k | 1.1k |
| Hugging Face downloads(Product adoption) | Not available | 96.6k |
| Hugging Face likes(Product adoption) | Not available | 220 |
| Product Hunt comments(Community interest) | Not available | 1 |
| Product Hunt rating(Community interest) | Not available | 5.0/5 |
| Product Hunt reviews(Community interest) | Not available | 13 |
| Product Hunt votes(Community interest) | Not available | 75 |
| PyPI weekly downloads(Developer adoption) | Not available | 11.0M |
As of September 14, 2026 — updated weekly.
Health & risk evidence
Observed public-source checks for mapped package versions and repositories.
Amazon CloudWatch
September 14, 2026Package vulnerabilities
npm · aws-embedded-metrics@4.2.1
0 vulnerabilities
across 1 package
Repository security score
Not available
Datadog
September 14, 2026Package vulnerabilities
PyPI · datadog@0.53.0 · npm · dd-trace@6.16.0
0 vulnerabilities
across 2 packages
Repository security score
github.com/DataDog/datadog-agent
5.9/10
Interface Preview
Amazon CloudWatch
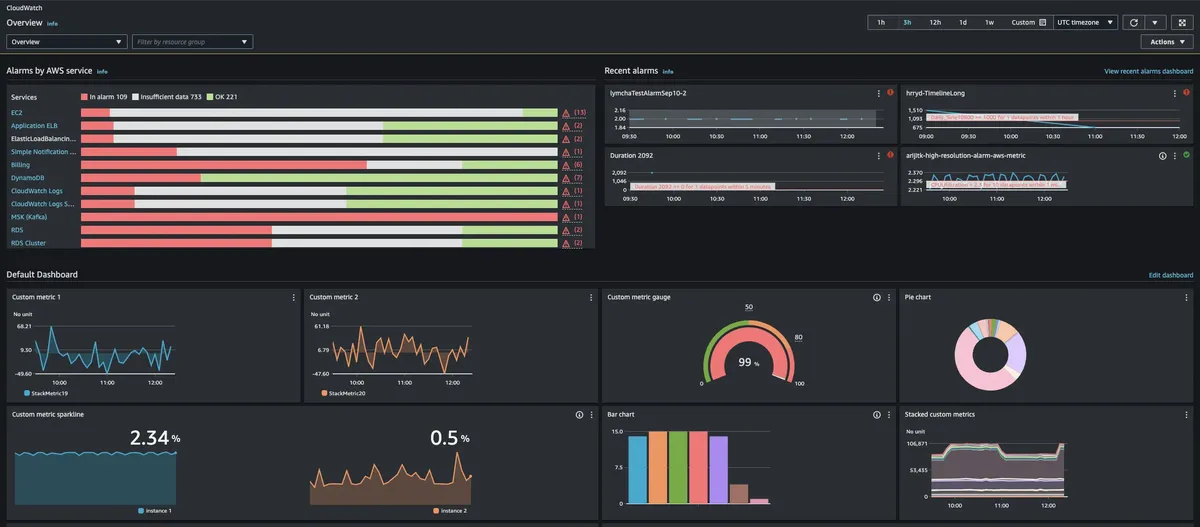
Feature Comparison
| Feature | Amazon CloudWatch | Datadog |
|---|---|---|
| Deployment Scope | ||
| Environment visibility | Cross-account observability consolidates telemetry from multiple AWS accounts. | Unifies network visibility across clouds, applications, and devices. |
| Container and serverless coverage | Container Insights monitors containerized application workloads and infrastructure. | Serverless monitoring provides a comprehensive view of serverless environments. |
| Operational views | Unified dashboards provide a centralized operational view of AWS workloads. | Auto-generated service overviews organize modern application service visibility. |
| Application Observability | ||
| Application performance monitoring | Application Insights supplies application performance monitoring and troubleshooting context. | APM monitors, optimizes, and investigates application performance. |
| Latency and error analysis | Log and metrics correlation connects operational signals during diagnosis. | Graphs and alerts on error rates or latency percentiles. |
| End-user monitoring | Application Insights focuses on application performance and operational insights. | Real User Monitoring tracks user journeys and frontend performance. |
| Telemetry Management | ||
| Log handling | CloudWatch Agent collects and exports host-level logs from Linux or Windows. | Log Management analyzes and explores logs for rapid troubleshooting. |
| Metric processing | Stream Metrics delivers real-time metric streaming for downstream consumption. | Time series data supports monitoring and graphical operational analysis. |
| Signal correlation | Correlates logs and metrics within the CloudWatch operational workflow. | Automated tagging and correlation connect log data across services. |
| Alerting and Operations | ||
| Alert composition | Composite alarms combine alarm states; high-resolution alarms support detailed signals. | Graphs and alerts evaluate error rates and latency percentiles. |
| Security monitoring | Provides visibility into performance, availability, and security signals. | Security Monitoring identifies potential threats in real time. |
| Troubleshooting approach | Uses AWS operational expertise and managed observability capabilities for diagnosis. | Combines logs, APM, network data, and service overviews for investigation. |
| Extensibility and Delivery | ||
| Open standards integration | Integrates telemetry through OpenTelemetry alongside managed CloudWatch services. | Datadog Agent repository supports metrics, logging, monitoring, and distributed tracing. |
| Host telemetry collection | CloudWatch Agent exports host-level metrics and logs from Linux and Windows. | Datadog Agent is the primary repository for agent-based telemetry collection. |
| Programmatic access | Metric streaming exports operational metrics in real time. | Users identify the REST API as a reported product strength. |
Deployment Scope
Environment visibility
Container and serverless coverage
Operational views
Application Observability
Application performance monitoring
Latency and error analysis
End-user monitoring
Telemetry Management
Log handling
Metric processing
Signal correlation
Alerting and Operations
Alert composition
Security monitoring
Troubleshooting approach
Extensibility and Delivery
Open standards integration
Host telemetry collection
Programmatic access
Which approach fits
Choose Amazon CloudWatch when AWS-native operation, cross-account visibility, Container Insights, and managed AWS integration are the primary requirements. Choose Datadog when a team needs a broad SaaS observability suite spanning APM, log management, network monitoring, synthetic monitoring, and real-user monitoring across cloud environments.
When each approach fits
Choose Amazon CloudWatch if:
Choose it for predominantly AWS-hosted systems, especially when monitoring multiple AWS accounts, container workloads, high-resolution alarms, and AWS service telemetry from one managed platform.
Choose Datadog if:
Choose it for multi-cloud or application-centric organizations that need correlated logs, traces, metrics, network visibility, frontend journeys, and service overviews in one SaaS platform.
These scenarios reflect the available product evidence. Your requirements, existing stack, and team expertise should guide the final decision.
Frequently Asked Questions
What is the main difference between Amazon CloudWatch and Datadog?
Amazon CloudWatch is AWS's managed observability service and is particularly suited to AWS environments. Its supplied capabilities include cross-account observability, Container Insights, Application Insights, dashboards, composite alarms, high-resolution alarms, log-and-metric correlation, and metric streaming. Datadog is a SaaS observability platform focused on bringing together logs, APM, network monitoring, synthetic monitoring, serverless monitoring, and real-user monitoring across clouds, applications, and devices. The practical distinction is AWS-native operational integration versus a broader cross-environment observability suite.
Which is better for small teams?
For a small team running mainly on AWS, CloudWatch is often the more direct fit because it is already part of the AWS platform, has a free tier, and provides managed dashboards, alarms, log handling, metrics, and application visibility. Datadog can be a stronger option for a small team with workloads across multiple clouds or a need for APM, frontend user journeys, synthetic tests, and network visibility in one interface. However, its usage-based model and reported setup learning curve make cost controls and onboarding important.
Can I migrate from Amazon CloudWatch to Datadog?
Yes, but treat the move as an observability redesign rather than a simple data transfer. Inventory existing CloudWatch dashboards, alarms, logs, metrics, Container Insights usage, Application Insights configuration, and cross-account access patterns. Then deploy and configure Datadog Agent collection where appropriate, map alert conditions to Datadog monitors, recreate dashboards, define tagging standards, and validate log, metric, and trace correlation. OpenTelemetry can help standardize instrumentation during the transition. Run both systems in parallel long enough to validate alerts, service coverage, retention needs, and Datadog usage costs.
What are the pricing differences?
CloudWatch has a free tier with published allowances and then bills per unit rather than by monthly plan: metric ingestion is $0.50 per GB, PromQL queries $0.01 per million samples scanned, and metric centralization $0.05 per GB after the first copy. Its cost therefore depends on the AWS observability services and volume consumed. Datadog also has a free tier and usage-based pricing, with paid plans starting at $0.75 per host per month. Its official supplied pricing data also lists $2, $4.40, and $1,000 price points, while logs, metrics, and enabled features can add usage-driven cost.