Decision comparison
Datadog vs Monte Carlo
Datadog dominates infrastructure and application observability for DevOps teams, while Monte Carlo leads in data pipeline observability and AI agent monitoring for data engineering teams. These tools solve fundamentally different problems and often complement each other in modern data stacks.
Architecture choice. These take different approaches to the same problem. Read the table as a fit question rather than a feature race.
These are different kinds of product — Observability Platform and Data Observability.
Quick Comparison
| Decision factor | Datadog | Monte Carlo |
|---|---|---|
| Primary Focus | Full-stack infrastructure, application, and network monitoring with 600+ integrations across cloud environments | Data and AI observability with ML-driven anomaly detection for data pipelines, warehouses, and BI layers |
| Pricing Model | Free tier available, paid plans start at $0.75 per host per month, additional costs based on usage and features | Monte Carlo publishes no amounts. Its tiers are Start, Scale, Enterprise and Business Critical, purchased as credits, and all are quote-only. Every tier includes agent, ML and data observability. |
| Core Strength | Unified infrastructure monitoring combining metrics, logs, traces, and security in a single SaaS platform | End-to-end column-level lineage and automated data quality monitoring from ingestion to consumption layer |
| Integration Ecosystem | Over 600 technology integrations spanning AWS, Azure, GCP, Kubernetes, Docker, and hundreds of third-party services | Deep integrations with Snowflake, Databricks, BigQuery, data warehouses, BI tools, ETL pipelines, and Salesforce Data Cloud |
| AI Capabilities | AI-powered observability recognized as Leader in Forrester Wave AIOps Platforms Q2 2025 and Gartner Magic Quadrant | AI-powered monitoring agents that automatically create monitors, recommend coverage, and perform root cause analysis |
| Target Audience | DevOps, SRE, and IT operations teams managing cloud infrastructure and application performance at scale | Data engineering and analytics teams ensuring data quality, pipeline reliability, and AI agent trustworthiness |
Datadog
- Primary Focus:
- Full-stack infrastructure, application, and network monitoring with 600+ integrations across cloud environments
- Pricing Model:
- Free tier available, paid plans start at $0.75 per host per month, additional costs based on usage and features
- Core Strength:
- Unified infrastructure monitoring combining metrics, logs, traces, and security in a single SaaS platform
- Integration Ecosystem:
- Over 600 technology integrations spanning AWS, Azure, GCP, Kubernetes, Docker, and hundreds of third-party services
- AI Capabilities:
- AI-powered observability recognized as Leader in Forrester Wave AIOps Platforms Q2 2025 and Gartner Magic Quadrant
- Target Audience:
- DevOps, SRE, and IT operations teams managing cloud infrastructure and application performance at scale
Monte Carlo
- Primary Focus:
- Data and AI observability with ML-driven anomaly detection for data pipelines, warehouses, and BI layers
- Pricing Model:
- Monte Carlo publishes no amounts. Its tiers are Start, Scale, Enterprise and Business Critical, purchased as credits, and all are quote-only. Every tier includes agent, ML and data observability.
- Core Strength:
- End-to-end column-level lineage and automated data quality monitoring from ingestion to consumption layer
- Integration Ecosystem:
- Deep integrations with Snowflake, Databricks, BigQuery, data warehouses, BI tools, ETL pipelines, and Salesforce Data Cloud
- AI Capabilities:
- AI-powered monitoring agents that automatically create monitors, recommend coverage, and perform root cause analysis
- Target Audience:
- Data engineering and analytics teams ensuring data quality, pipeline reliability, and AI agent trustworthiness
Public signals
Verified factual signals only. Bars appear only for like-for-like metrics with five weekly assessments for every tool; missing evidence stays explicit. These signals do not establish enterprise adoption, product quality, or total cost.
| Metric | Datadog | Monte Carlo |
|---|---|---|
| GitHub commits, 90d(Developer adoption) | 2.4k | 243 |
| GitHub stars(Developer adoption) | 3,500+ | 2 |
| Search interest(Market interest) | 14 | 0 |
| Hacker News mentions, 90d(Community interest) | 16 | 0 |
| Hugging Face downloads(Product adoption) | 96.6k | Not available |
| Hugging Face likes(Product adoption) | 220 | Not available |
| npm weekly downloads(Developer adoption) | 7.3M | Not available |
| Product Hunt comments(Community interest) | 1 | Not available |
| Product Hunt rating(Community interest) | 5.0/5 | Not available |
| Product Hunt reviews(Community interest) | 13 | Not available |
| Product Hunt votes(Community interest) | 75 | Not available |
| PyPI weekly downloads(Developer adoption) | 11.0M | 38.1k |
| Stack Overflow questions(Community interest) | 1.1k | Not available |
As of September 14, 2026 — updated weekly.
Health & risk evidence
Observed public-source checks for mapped package versions and repositories.
Datadog
September 14, 2026Package vulnerabilities
PyPI · datadog@0.53.0 · npm · dd-trace@6.16.0
0 vulnerabilities
across 2 packages
Repository security score
github.com/DataDog/datadog-agent
5.9/10
Monte Carlo
September 14, 2026Package vulnerabilities
PyPI · montecarlodata@0.175.0
0 vulnerabilities
across 1 package
Repository security score
Not available
Interface Preview
Monte Carlo
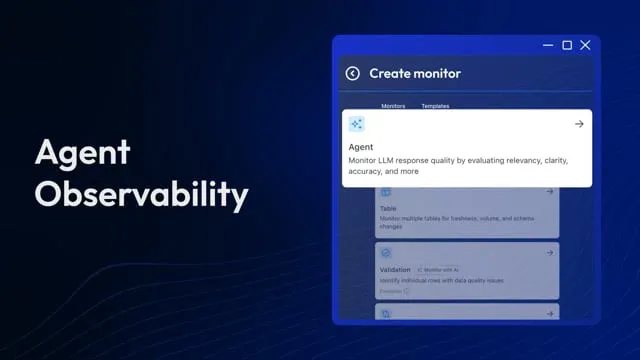
Feature Comparison
| Feature | Datadog | Monte Carlo |
|---|---|---|
| Monitoring & Detection | ||
| Anomaly Detection | Infrastructure and APM anomaly detection with configurable alert thresholds on any metric across hosts and clusters | ML-driven anomaly detection across freshness, volume, schema, and distribution for data tables automatically |
| Real-Time Alerting | Multi-channel notifications via email, PagerDuty, Slack with complex trigger conditions and mute controls | Granular alert routing with automated lineage grouping and root-cause insights for targeted triage |
| Synthetic Monitoring | Proactive AI-driven synthetic monitoring with web recorder for critical user journey testing and SLA management | Not verified |
| Data Lineage & Tracing | ||
| Distributed Tracing | End-to-end request tracing across distributed systems with auto-generated service overviews and latency percentiles | Data flow lineage tracking across entire data ecosystem with visual dependency mapping and impact assessment |
| Column-Level Lineage | Not verified | End-to-end column-level lineage showing upstream and downstream dependencies across the data ecosystem |
| Impact Analysis | Service dependency mapping showing impact of infrastructure issues on application performance metrics | Downstream impact analysis for dashboards and business processes with comprehensive dependency assessment |
| Dashboard & Visualization | ||
| Custom Dashboards | Real-time interactive dashboards with high-resolution metrics, tag-based slicing, and code-based customization | Data health dashboards showing monitor status, coverage gaps, and pipeline performance at a glance |
| Log Analytics | Full log management with automated tagging, correlation, search, filtering, and visualization capabilities | Not available as standalone; monitors data quality metrics rather than raw application logs |
| Network Monitoring | Unified network visibility across multi-cloud, hybrid, and on-premises environments with intelligent insights | Not verified |
| AI & Automation | ||
| AI-Powered Agents | AI-driven monitoring and security with automated tagging and correlation across all observability signals | Monitoring agents that auto-create monitors, recommend coverage, and deploy monitoring strategies in minutes |
| Root Cause Analysis | Cross-signal correlation across metrics, logs, and traces for infrastructure root cause identification | Automated root cause analysis with enriched lineage data showing why data breaks happen and who to notify |
| Automated Coverage | Auto-discovery of hosts and services with turn-key integrations across the full DevOps stack | Automatic baseline coverage for freshness, volume, and schema with AI-powered autoscaling as environment grows |
| Enterprise & Security | ||
| Security Monitoring | Real-time threat detection with Cloud SIEM, compliance tools, and DevSecOps security posture analysis | Advanced security via SSO, SCIM, self-hosted storage, PII filtering, and audit logging in Scale tier and above |
| API Access | Full RESTful HTTP API for data access, custom integrations, and JSON-formatted dashboard generation | Tiered API access: 10,000 calls/day on Start, 50,000 on Scale, 100,000 on Enterprise plans |
| Deployment Options | Cloud-only SaaS deployment with no self-hosted or on-premises option available for data residency | SaaS with self-hosted storage option available on Scale tier and above for data residency requirements |
Monitoring & Detection
Anomaly Detection
Real-Time Alerting
Synthetic Monitoring
Data Lineage & Tracing
Distributed Tracing
Column-Level Lineage
Impact Analysis
Dashboard & Visualization
Custom Dashboards
Log Analytics
Network Monitoring
AI & Automation
AI-Powered Agents
Root Cause Analysis
Automated Coverage
Enterprise & Security
Security Monitoring
API Access
Deployment Options
Which approach fits
Datadog dominates infrastructure and application observability for DevOps teams, while Monte Carlo leads in data pipeline observability and AI agent monitoring for data engineering teams. These tools solve fundamentally different problems and often complement each other in modern data stacks.
When each approach fits
Choose Datadog if:
We recommend Datadog for DevOps and SRE teams that need comprehensive infrastructure monitoring, application performance management, and security observability across cloud environments. Datadog excels when you manage complex multi-cloud deployments with hundreds of services and need unified visibility into metrics, logs, traces, and network performance. Its 600+ integrations, real-time dashboards, and Gartner-recognized AIOps capabilities make it the stronger choice for teams focused on application uptime, latency optimization, and infrastructure health monitoring at scale.
Choose Monte Carlo if:
We recommend Monte Carlo for data engineering and analytics teams that need to ensure data quality, pipeline reliability, and trustworthy AI agent outputs across their data stack. Monte Carlo excels when your primary concern is detecting data incidents before they reach dashboards and business decisions. Its end-to-end column-level lineage, ML-driven anomaly detection, and automated monitoring agents make it the stronger choice for organizations building data-driven products, operating data meshes, or deploying AI agents in production where data trust directly impacts business outcomes.
These scenarios reflect the available product evidence. Your requirements, existing stack, and team expertise should guide the final decision.
Frequently Asked Questions
Can Datadog and Monte Carlo be used together?
Datadog and Monte Carlo solve different observability problems and work well together in modern data stacks. Datadog monitors infrastructure health, application performance, and system-level metrics, while Monte Carlo monitors data quality, pipeline freshness, and data anomalies. Many enterprise teams run both platforms simultaneously: Datadog tracks whether your Airflow cluster is healthy and your Spark jobs are running, while Monte Carlo tracks whether the data those pipelines produce is accurate, fresh, and complete. Using both tools provides end-to-end coverage from infrastructure through data quality.
How do Datadog and Monte Carlo differ in their approach to anomaly detection?
Datadog detects anomalies in infrastructure and application metrics such as CPU usage, memory consumption, error rates, and latency percentiles. Its alerting system triggers notifications when configurable thresholds are breached across hosts, clusters, or services. Monte Carlo uses ML-driven anomaly detection focused specifically on data quality dimensions: freshness (is data arriving on time), volume (are row counts consistent), schema changes (did columns appear or disappear), and distribution shifts (did values change unexpectedly). The distinction is that Datadog catches system failures while Monte Carlo catches silent data quality degradation that systems cannot detect.
Which platform offers better value for small teams?
For small DevOps teams, Datadog offers a free tier and paid plans starting at $0.75 per host per month, though costs compound quickly across infrastructure monitoring ($15-$23/host/month), APM ($31-$40/host/month), and log ingestion ($0.10/GB). Monte Carlo offers a Start tier for small teams with up to 10 users, pay-per-monitor pricing up to 1,000 monitors, and 10,000 API calls per day. The choice depends on what you monitor: if you need infrastructure observability, Datadog's free tier provides a strong starting point. If you need data quality monitoring, Monte Carlo's Start tier provides self-guided onboarding and automated monitoring out of the box.
What enterprise customers use each platform?
Datadog serves over 30,500 customers worldwide, including over 40% of the Fortune 500. Notable customers include Airbnb, Samsung, Whole Foods, and Peloton. The platform generated over $3 billion in annual revenue in FY 2025, with the number of customers spending over $100,000 annually growing nearly 20% year-over-year. Monte Carlo counts major enterprises among its customers, including Axios (using Agent Observability for AI monitoring), JetBlue (which improved internal Data NPS by 16 points year-over-year), and Nasdaq (monitoring 6,000 reports per day across 35 services and 2,200 users). Monte Carlo positions itself as battle-tested across hundreds of production environments.