Decision comparison
Amazon QuickSight vs Spotfire
QuickSight and Spotfire are built for different jobs and priced accordingly. QuickSight delivers dashboards to a wide internal audience inside AWS, billed per session so occasional readers cost what they use. Spotfire is an exploration tool for analysts, with linked visualisations, drill paths and statistical work in the same canvas.
Direct comparison. These are reviewed substitutes bought for the same job, so the differences below are the ones that decide between them.
All 2 are BI platforms.
Quick Comparison
| Decision factor | Amazon QuickSight | Spotfire |
|---|---|---|
| What it is | AWS's BI service, priced per session for readers and backed by the SPICE in-memory engine | An analytics platform built around interactive visual exploration, with R and Python available beside the charts |
| Primary user | Business readers across an AWS organisation | Analysts exploring data whose questions are not yet fixed |
| Pricing model | Per-user pricing: Reader $3 per user/month, Reader Pro $20 per user/month, Author $24 per user/month and Author Pro $40 per user/month. A $250/month per-account infrastructure fee applies to some configurations. Capacity pricing starts at $250/month for 500 sessions with additional sessions at $0.50, or $20,000/year for 50,000 sessions with additional sessions at $0.40. Enterprise pricing on request. The captured pricing page states no free tier. | Spotfire Analytics is listed with a 365-day duration. The supplied plan data includes 3000.0 but does not state a currency, so it is not a usable public price. |
| Analysis depth | Dashboards, filters and natural language over prepared datasets | Linked visualisations, drill paths and R or Python beside the charts |
| Engine | SPICE in-memory engine, or direct query against the source | Live querying or in-memory extracts, depending on the source |
| Deployment | AWS service | Cloud or on-premise, depending on licensing |
| Best fit | Wide internal readership inside AWS at predictable cost | Deep exploratory and statistical work by a smaller group |
| Connectivity | Connects to Snowflake, BigQuery, Redshift and Databricks over standard drivers, with REST APIs for automation | Connects to Snowflake, BigQuery, Redshift and Databricks over standard drivers, with REST APIs for automation |
Amazon QuickSight
- What it is:
- AWS's BI service, priced per session for readers and backed by the SPICE in-memory engine
- Primary user:
- Business readers across an AWS organisation
- Pricing model:
- Per-user pricing: Reader $3 per user/month, Reader Pro $20 per user/month, Author $24 per user/month and Author Pro $40 per user/month. A $250/month per-account infrastructure fee applies to some configurations. Capacity pricing starts at $250/month for 500 sessions with additional sessions at $0.50, or $20,000/year for 50,000 sessions with additional sessions at $0.40. Enterprise pricing on request. The captured pricing page states no free tier.
- Analysis depth:
- Dashboards, filters and natural language over prepared datasets
- Engine:
- SPICE in-memory engine, or direct query against the source
- Deployment:
- AWS service
- Best fit:
- Wide internal readership inside AWS at predictable cost
- Connectivity:
- Connects to Snowflake, BigQuery, Redshift and Databricks over standard drivers, with REST APIs for automation
Spotfire
- What it is:
- An analytics platform built around interactive visual exploration, with R and Python available beside the charts
- Primary user:
- Analysts exploring data whose questions are not yet fixed
- Pricing model:
- Spotfire Analytics is listed with a 365-day duration. The supplied plan data includes 3000.0 but does not state a currency, so it is not a usable public price.
- Analysis depth:
- Linked visualisations, drill paths and R or Python beside the charts
- Engine:
- Live querying or in-memory extracts, depending on the source
- Deployment:
- Cloud or on-premise, depending on licensing
- Best fit:
- Deep exploratory and statistical work by a smaller group
- Connectivity:
- Connects to Snowflake, BigQuery, Redshift and Databricks over standard drivers, with REST APIs for automation
Public signals
Verified factual signals only. Bars appear only for like-for-like metrics with five weekly assessments for every tool; missing evidence stays explicit. These signals do not establish enterprise adoption, product quality, or total cost.
| Metric | Amazon QuickSight | Spotfire |
|---|---|---|
| Search interest(Market interest) | 0 | 1 |
| npm weekly downloads(Developer adoption) | 140.3k | 22 |
| Product Hunt comments(Community interest) | 2 | Not available |
| Product Hunt rating(Community interest) | 5.0/5 | Not available |
| Product Hunt reviews(Community interest) | 1 | Not available |
| Product Hunt votes(Community interest) | 78 | Not available |
| Stack Overflow questions(Community interest) | 718 | 1.6k |
| GitHub commits, 90d(Developer adoption) | Not available | 10 |
| GitHub stars(Developer adoption) | Not available | 62 |
| Hacker News mentions, 90d(Community interest) | Not available | 0 |
| PyPI weekly downloads(Developer adoption) | Not available | 1.5k |
As of September 21, 2026 — updated weekly.
Health & risk evidence
Observed public-source checks for mapped package versions and repositories.
Amazon QuickSight
September 21, 2026Package vulnerabilities
npm · amazon-quicksight-embedding-sdk@2.11.3
0 vulnerabilities
across 1 package
Repository security score
Not available
Spotfire
September 21, 2026Package vulnerabilities
npm · @spotfire/mods-sdk@1.2.0 · PyPI · spotfire@2.4.2
0 vulnerabilities
across 2 packages
Repository security score
Not available
Interface Preview
Amazon QuickSight
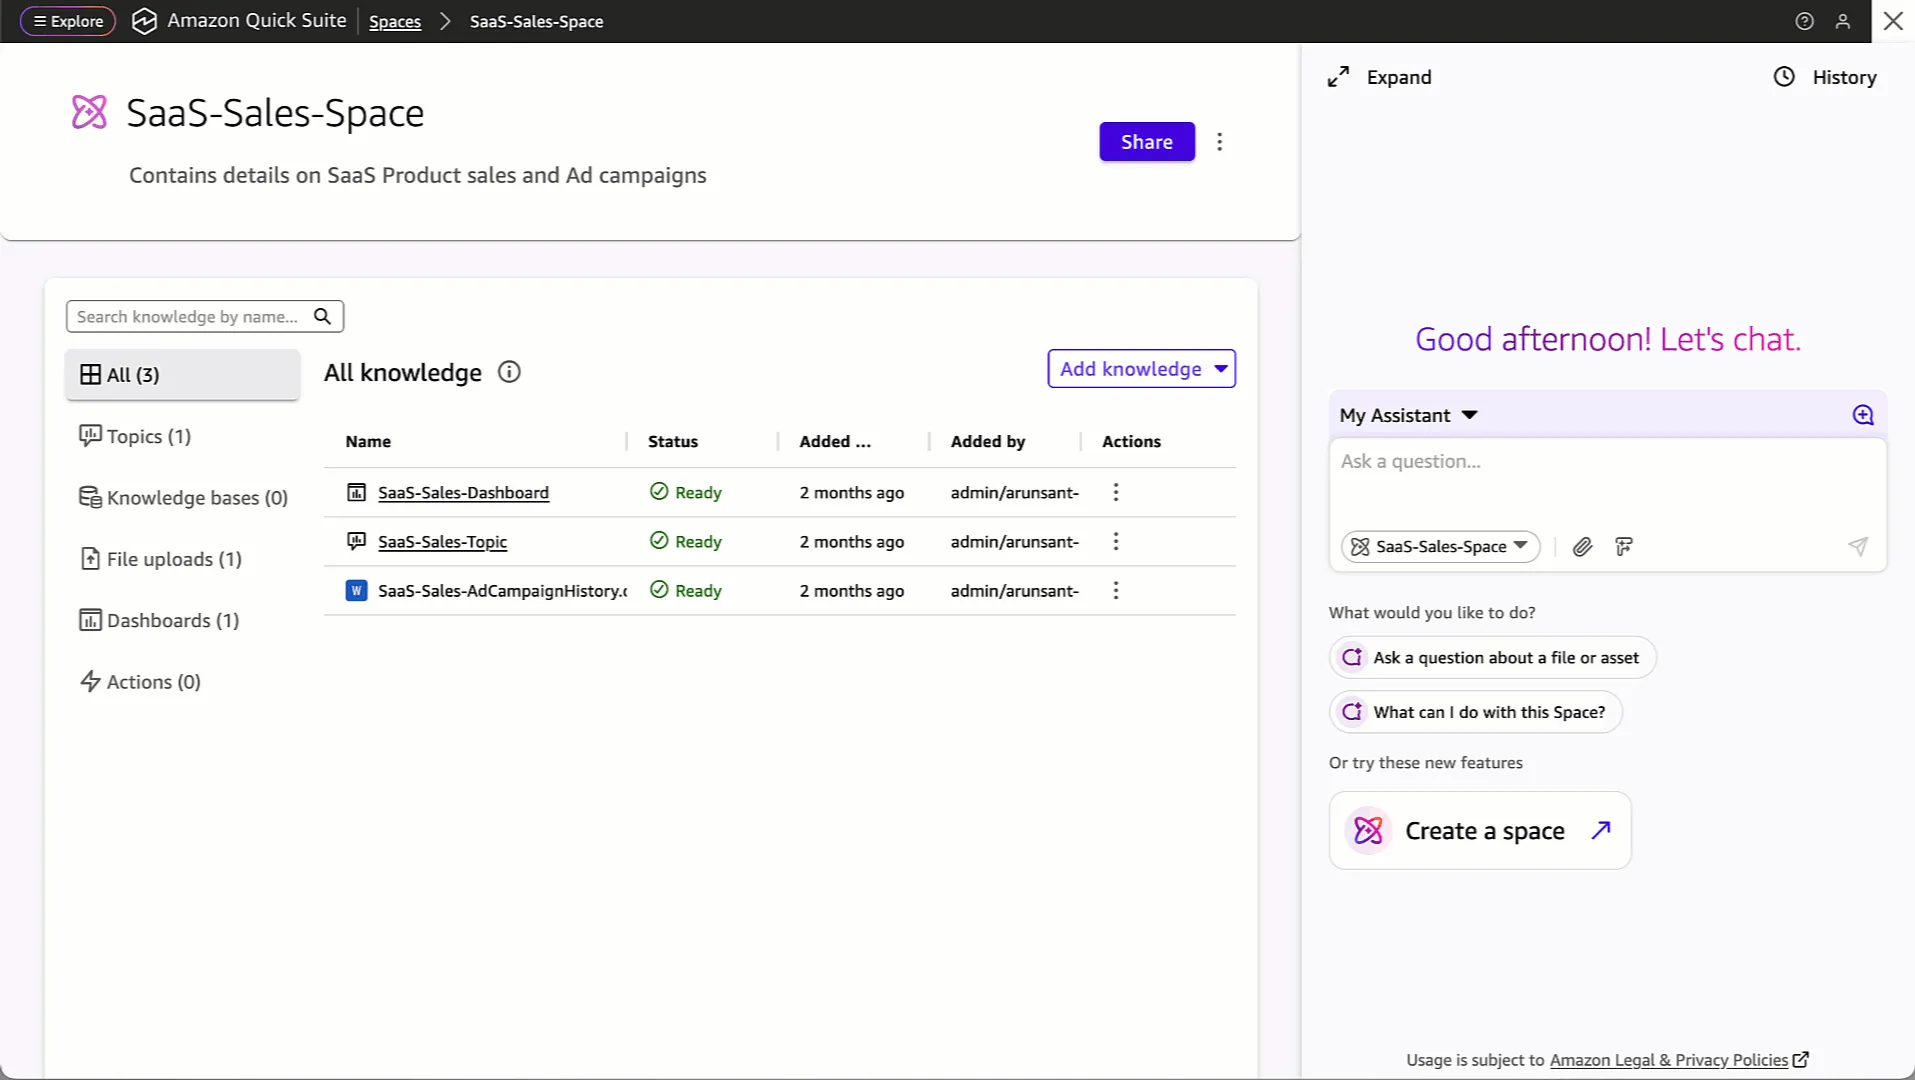
Feature Comparison
| Feature | Amazon QuickSight | Spotfire |
|---|---|---|
| Analysis | ||
| Linked visualisations and drill paths | Partial support | Full support |
| R and Python integration | Not verified | Full support |
| Ad-hoc exploration outside a prepared view | Partial support | Full support |
| Natural language querying | Full support | Partial support |
| Commercial | ||
| Per-session pricing for readers | Full support | Not verified |
| Cost scales with use rather than headcount | Full support | Not verified |
| Native cloud integration | Full support | Partial support |
| On-premise deployment | Not verified | Full support |
| Delivery | ||
| Embedding in your own application | Full support | Full support |
| Alerting on data changes | Full support | Full support |
| Mobile access | Partial support | Partial support |
| Own in-memory engine | Full support | Partial support |
| Platform | ||
| Warehouse connectivity | Full support | Full support |
| Scheduled distribution | Full support | Full support |
| Row-level security | Full support | Full support |
| REST API for automation | Full support | Full support |
Analysis
Linked visualisations and drill paths
R and Python integration
Ad-hoc exploration outside a prepared view
Natural language querying
Commercial
Per-session pricing for readers
Cost scales with use rather than headcount
Native cloud integration
On-premise deployment
Delivery
Embedding in your own application
Alerting on data changes
Mobile access
Own in-memory engine
Platform
Warehouse connectivity
Scheduled distribution
Row-level security
REST API for automation
Which to choose
QuickSight and Spotfire are built for different jobs and priced accordingly. QuickSight delivers dashboards to a wide internal audience inside AWS, billed per session so occasional readers cost what they use. Spotfire is an exploration tool for analysts, with linked visualisations, drill paths and statistical work in the same canvas.
Best-fit scenarios
Choose Amazon QuickSight if:
Choose Amazon QuickSight when many people need to read a small number of trustworthy dashboards and the organisation is on AWS. Per-session pricing makes a wide occasional audience affordable, IAM is the access model you already administer, and SPICE keeps interaction fast without querying the source on every click.
Choose Spotfire if:
Choose Spotfire when a smaller group does deep analytical work. Following a question through linked visualisations, reaching past a prepared view, and running R or Python beside the charts are what an exploration tool provides and a reader-oriented dashboard product does not.
These scenarios reflect the available product evidence. Your requirements, existing stack, and team expertise should guide the final decision.
Frequently Asked Questions
Are these competing for the same budget?
They often are, and they should not be. One is priced for breadth — many readers, occasional use — and the other for depth by a few specialists. Comparing per-session rates against per-analyst licences without separating the audiences produces a number that means nothing. Split the audience first, then price each half.
What does exploration need that dashboards do not?
The ability to change the question. A dashboard offers filters somebody else chose; an exploration tool lets an analyst pivot, brush across linked charts and follow a lead without rebuilding anything. If your users mostly read numbers somebody prepared, that capability goes unused. If they arrive with open questions, it is the product.
Where do metric definitions live in each?
QuickSight defines calculated fields on datasets, reusable across the analyses built from them, and nothing prevents a second dataset defining the same measure differently — the route to revenue being computed three ways across forty dashboards. Spotfire is looser still by design, because exploratory analysis needs measures that exist only for one investigation. Neither enforces a single definition, so the discipline has to come from outside the tool: define anything reported once in the warehouse, version controlled and tested, and let both read it.
Does it query the warehouse, or a copy?
Both commonly work on copies. QuickSight's SPICE loads data into memory on a schedule so dashboards stay fast and Redshift or Athena is not queried on every filter change, with direct query available when freshness matters more. Spotfire works over in-memory data because iterating on a method against a moving dataset is not a useful experiment, and connects live where required. The reasons differ — serving speed in one case, reproducibility in the other — and the consequence is the same: a refresh you own and a window where the number can lag the source.
How does licensing behave as the audience grows?
QuickSight's per-session reader pricing is built to make a wide internal audience inexpensive, with SPICE capacity as the line that grows with data rather than with people. Spotfire's per-user licensing stays flat as the company grows because its audience is a department of specialists, not the organisation. Each handles its own growth story well and the other one badly. Count readers and analysts separately, because a single blended headcount priced against either model produces a figure that matches no real deployment.
How should we evaluate them?
Build the same two things on both: the dashboard your executives read every Monday, and the open-ended question an analyst raised last quarter. The first tests modelling, refresh, delivery and governance; the second tests exploration. Most teams find one platform suited to each, which turns an abstract comparison into a decision about which half of the work matters more.