Decision comparison
Sentry vs Datadog
Choose Sentry when developers need an SDK-first workflow that ties production errors to releases, pull requests, owners, replay context, and AI-assisted fixes. Choose Datadog when a platform or operations team needs a wider SaaS observability estate covering infrastructure, logs, APM, networks, security, synthetics, RUM, and serverless workloads.
Architecture choice. These take different approaches to the same problem. Read the table as a fit question rather than a feature race.
These are different kinds of product — Error Tracking and Observability Platform.
Quick Comparison
| Decision factor | Sentry | Datadog |
|---|---|---|
| Best For | Developer teams prioritizing rapid error diagnosis, release-aware debugging, AI code review, and application performance context. | Operations and platform teams needing unified infrastructure, application, network, log, security, and user-experience monitoring at scale. |
| Architecture | SDK-first application monitoring: instrument code directly, then correlate errors, logs, replays, metrics, and profiling within traces. | SaaS observability platform using Datadog Agent telemetry, automated tags, correlated logs, service overviews, dashboards, and alerts. |
| Pricing Model | Developer tier free with 5K errors/month. Team plan starts at $26/month, Business at $80/month, Enterprise custom. Event-based billing across errors, performance, session replay, and profiling. | Free tier available, paid plans start at $0.75 per host per month, additional costs based on usage and features |
| Ease of Use | Five-line SDK integration and contextual Issue → Context → Fix workflow reduce setup effort for application-focused teams. | Broad product coverage brings setup and learning-curve challenges, although users highlight responsive support and powerful data exploration. |
| Scalability | Event-based usage spans errors, performance, replay, and profiling; capacity and cost scale with monitored application telemetry. | Designed for cloud environments, applications, and devices, with network visibility and service-level monitoring across distributed systems. |
| Community/Support | Developer-focused ecosystem integrates GitHub, Slack, Jira, Linear, and coding agents; repository has 44,741 GitHub stars. | Users rate it 8.6/10 across 346 reviews; the Datadog Agent repository has 3,713 GitHub stars and Apache-2.0 licensing. |
Sentry
- Best For:
- Developer teams prioritizing rapid error diagnosis, release-aware debugging, AI code review, and application performance context.
- Architecture:
- SDK-first application monitoring: instrument code directly, then correlate errors, logs, replays, metrics, and profiling within traces.
- Pricing Model:
- Developer tier free with 5K errors/month. Team plan starts at $26/month, Business at $80/month, Enterprise custom. Event-based billing across errors, performance, session replay, and profiling.
- Ease of Use:
- Five-line SDK integration and contextual Issue → Context → Fix workflow reduce setup effort for application-focused teams.
- Scalability:
- Event-based usage spans errors, performance, replay, and profiling; capacity and cost scale with monitored application telemetry.
- Community/Support:
- Developer-focused ecosystem integrates GitHub, Slack, Jira, Linear, and coding agents; repository has 44,741 GitHub stars.
Datadog
- Best For:
- Operations and platform teams needing unified infrastructure, application, network, log, security, and user-experience monitoring at scale.
- Architecture:
- SaaS observability platform using Datadog Agent telemetry, automated tags, correlated logs, service overviews, dashboards, and alerts.
- Pricing Model:
- Free tier available, paid plans start at $0.75 per host per month, additional costs based on usage and features
- Ease of Use:
- Broad product coverage brings setup and learning-curve challenges, although users highlight responsive support and powerful data exploration.
- Scalability:
- Designed for cloud environments, applications, and devices, with network visibility and service-level monitoring across distributed systems.
- Community/Support:
- Users rate it 8.6/10 across 346 reviews; the Datadog Agent repository has 3,713 GitHub stars and Apache-2.0 licensing.
Public signals
Verified factual signals only. Bars appear only for like-for-like metrics with five weekly assessments for every tool; missing evidence stays explicit. These signals do not establish enterprise adoption, product quality, or total cost.
| Metric | Sentry | Datadog |
|---|---|---|
| GitHub commits, 90d(Product adoption) | 4.8k | Not available |
| GitHub stars(Product adoption) | 44,000+ | Not available |
| Search interest(Market interest) | 30 | 14 |
| Hacker News mentions, 90d(Community interest) | 0 | 16 |
| npm weekly downloads(Developer adoption) | 26.0M | 7.3M |
| PyPI weekly downloads(Developer adoption) | 28.0M | 11.0M |
| Stack Overflow questions(Community interest) | 1.5k | 1.1k |
| GitHub commits, 90d(Developer adoption) | Not available | 2.4k |
| GitHub stars(Developer adoption) | Not available | 3,500+ |
| Hugging Face downloads(Product adoption) | Not available | 96.6k |
| Hugging Face likes(Product adoption) | Not available | 220 |
| Product Hunt comments(Community interest) | Not available | 1 |
| Product Hunt rating(Community interest) | Not available | 5.0/5 |
| Product Hunt reviews(Community interest) | Not available | 13 |
| Product Hunt votes(Community interest) | Not available | 75 |
As of September 14, 2026 — updated weekly.
Health & risk evidence
Observed public-source checks for mapped package versions and repositories.
Sentry
September 14, 2026Package vulnerabilities
npm · @sentry/node@10.74.0 · PyPI · sentry-sdk@2.68.1
0 vulnerabilities
across 2 packages
Repository security score
Not available
Datadog
September 14, 2026Package vulnerabilities
PyPI · datadog@0.53.0 · npm · dd-trace@6.16.0
0 vulnerabilities
across 2 packages
Repository security score
github.com/DataDog/datadog-agent
5.9/10
Interface Preview
Sentry
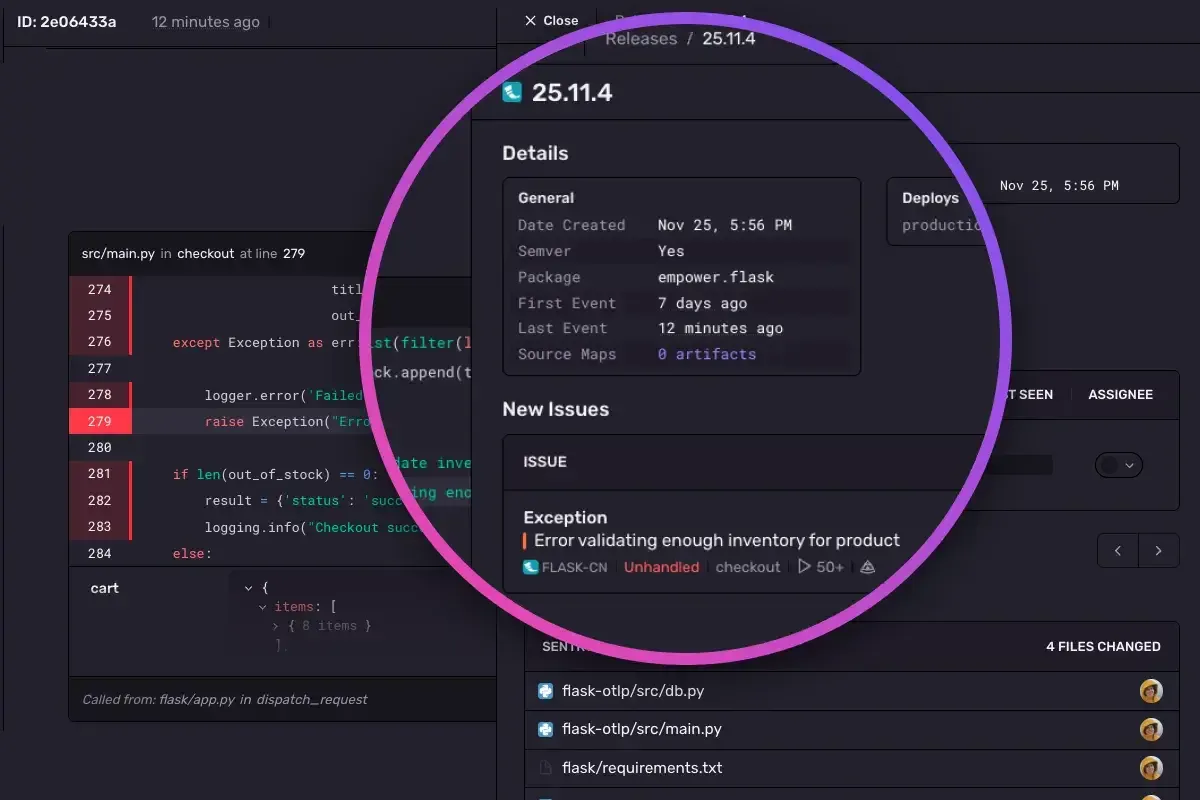
Feature Comparison
| Feature | Sentry | Datadog |
|---|---|---|
| Application debugging workflow | ||
| Error diagnosis | Automatically root-causes issues with contextual application debugging | Graphs and alerts on application error rates |
| Code remediation | Seer provides AI debugging and code-review assistance | Investigates application performance through APM telemetry |
| Release context | Maps incidents automatically to releases, PRs, and owners | Auto-generates service overviews for monitored applications |
| Telemetry correlation | ||
| Trace context | Unifies errors, logs, replays, and metrics under traces | Correlates application monitoring data across services |
| Log analysis | Connects logs to unified application trace context | Analyzes and explores logs for rapid troubleshooting |
| Performance monitoring | Captures performance and profiling as metered event types | Monitors latency percentiles and application performance |
| User and frontend visibility | ||
| Session replay | Captures replays alongside errors and trace context | Monitors frontend performance through Real User Monitoring |
| End-user experience | Uses replay and issue context for user-impact debugging | Monitors user journeys and frontend performance together |
| Synthetic checks | Not available in provided product feature data | Proactively monitors critical features with AI-driven synthetic monitoring |
| Infrastructure and network coverage | ||
| Infrastructure monitoring | Focuses provided capabilities on instrumented application monitoring | Moves from infrastructure overview to deep operational details |
| Network monitoring | Not available in provided product feature data | Analyzes cloud network traffic patterns across environments |
| Serverless visibility | Not available in provided product feature data | Provides comprehensive views of serverless applications |
| Workflow and ecosystem | ||
| Developer integrations | Integrates with GitHub, Slack, Jira, Linear, and MCP agents | Uses integrations to collect telemetry from apps and services |
| Pre-production prevention | Detects errors before merge using AI code review | Uses synthetic monitoring for proactive feature checks |
| Security monitoring | Not available in provided product feature data | Identifies potential threats in real time |
Application debugging workflow
Error diagnosis
Code remediation
Release context
Telemetry correlation
Trace context
Log analysis
Performance monitoring
User and frontend visibility
Session replay
End-user experience
Synthetic checks
Infrastructure and network coverage
Infrastructure monitoring
Network monitoring
Serverless visibility
Workflow and ecosystem
Developer integrations
Pre-production prevention
Security monitoring
Which approach fits
Choose Sentry when developers need an SDK-first workflow that ties production errors to releases, pull requests, owners, replay context, and AI-assisted fixes. Choose Datadog when a platform or operations team needs a wider SaaS observability estate covering infrastructure, logs, APM, networks, security, synthetics, RUM, and serverless workloads.
When each approach fits
Choose Sentry if:
Choose Sentry for product engineering teams debugging application failures and regressions, especially when GitHub-based release context, issue ownership, session replay, profiling, and Seer-assisted remediation are central.
Choose Datadog if:
Choose Datadog for organizations operating broad cloud estates that require centralized infrastructure, network, log, security, APM, synthetic, real-user, and serverless monitoring.
These scenarios reflect the available product evidence. Your requirements, existing stack, and team expertise should guide the final decision.
Frequently Asked Questions
What is the main difference between Sentry and Datadog?
Sentry is centered on developer-first application monitoring and remediation. Its SDK-based approach captures errors and performance context, then connects incidents to releases, pull requests, owners, logs, replays, metrics, and profiling. Seer adds AI-powered root-cause analysis, debugging, and pre-merge code review. Datadog is a broader SaaS observability platform for IT, Dev, and Ops teams, covering infrastructure, logs, APM, networks, security monitoring, synthetic tests, Real User Monitoring, and serverless applications.
Which is better for small teams?
For a small application-development team, Sentry is usually the more direct fit when the main problem is finding and fixing production errors quickly. Its Developer tier includes 5K errors per month, and the provided workflow emphasizes five-line SDK setup plus release and pull-request context. Datadog can suit a small team that also needs infrastructure, network, log, and user-experience visibility in one platform, but users specifically report setup and learning-curve concerns. Its free tier is available, while paid usage starts at $0.75 per host per month.
Can I migrate from Sentry to Datadog?
Yes, but this is an observability implementation project rather than a direct data migration. Instrument applications with Datadog’s Agent and APM capabilities, recreate dashboards, monitors, alert routes, tagging conventions, log pipelines, retention expectations, and integrations, then run both platforms during validation. Sentry-specific items such as issue grouping, release-to-PR mappings, Seer workflows, and session-replay investigation practices need replacement processes in Datadog. Review event volume and host, log, metric, and feature consumption before switching because Datadog bills usage across services.
What are the pricing differences?
Sentry publishes tiered entry pricing and clear included free-tier capacity: Developer is free for 5K errors per month, Team starts at $26 per month, Business starts at $80 per month, and Enterprise is custom priced. Its billing is event-based across errors, performance, session replay, and profiling. Datadog has a free tier and a usage-based model beginning at $0.75 per host per month, with additional costs based on usage and enabled features. Its official pricing material also lists $2, $4.40, and $1,000 price points, plus volume or multi-year discounts.