300+ Tools CoveredSource Data Updated Weeklydates

Tool intelligence profile

KNIME

Free and open source with all your data analysis tools. Create data science solutions with the visual workflow builder & put them into production in the enterprise.

Visit Site →
Type
Data Preparation Tool
Deployment
Cloud or self-hosted
Last updatedSeptember 21, 2026Open Source

Editor's Take

We recommend KNIME for analyst and data-science teams that want a free, open-source visual workflow builder for data preparation, analysis, and production-oriented workflows without committing to per-user BI licensing. It is a strong fit for small teams or budget-constrained departments, but the available context does not establish enterprise-scale adoption, governance depth, or total deployment cost.

— Egor Burlakov, Editor

Evaluate KNIME

Comparisons

KNIME: product and architecture

Our decision: KNIME is a strong choice for teams that want an open-source visual workflow platform for assembling, operationalizing, and reusing data-science solutions without beginning from code. This knime review recommends it for organizations building citizen-data-science capability alongside engineering governance, but not for buyers seeking evidence of named enterprise integrations, published performance benchmarks, or transparent paid-plan entitlements. KNIME Analytics Platform is open-source software focused on creating data science through visual workflows and reusable components.

Overview

KNIME is a visual data-science workflow platform, not simply a dashboarding product. Its stated purpose is to make data understanding, workflow design, reusable components, and new data-science developments accessible to a broad set of users. That positioning matters: teams should evaluate KNIME primarily as a way to construct and run repeatable analytical processes, rather than as a replacement for a specialized semantic layer, a standalone BI visualization suite, or a code-first machine-learning environment.

The product’s practical appeal is its combination of an open-source Analytics Platform and paid offerings for collaboration, governance, and scale. The free platform is explicitly available for personal use, while the vendor positions paid offerings as the path for teams that need to collaborate, govern, and scale. This is a sensible split for individual exploration, but procurement teams should treat the “personal use” wording as a meaningful boundary rather than assume the free platform covers every organizational use case.

KNIME’s own product description emphasizes adoption through citizen-data-scientist training. Allan Luk, Director of Data Science and Analytics Business Solutions, states that engineers progressed from complete beginners to analytics practitioners within a few months as part of a corporate training program. That is useful evidence about the intended learning path, although it is a customer statement rather than an independently measured adoption metric.

We recommend KNIME for data teams that value visual workflow construction, reusable analytical building blocks, and an open-source starting point. Choose another product if your decision depends on disclosed enterprise customer counts, documented workload benchmarks, named integration depth, or fully specified commercial-plan packaging; the supplied evidence does not establish those items for KNIME. Its public GitHub repository is primarily Java and had 0 stars, with a last push recorded on 2026-07-29T12:00:32Z; these are public repository signals, not proof of enterprise adoption or product quality.

Key Features and Architecture

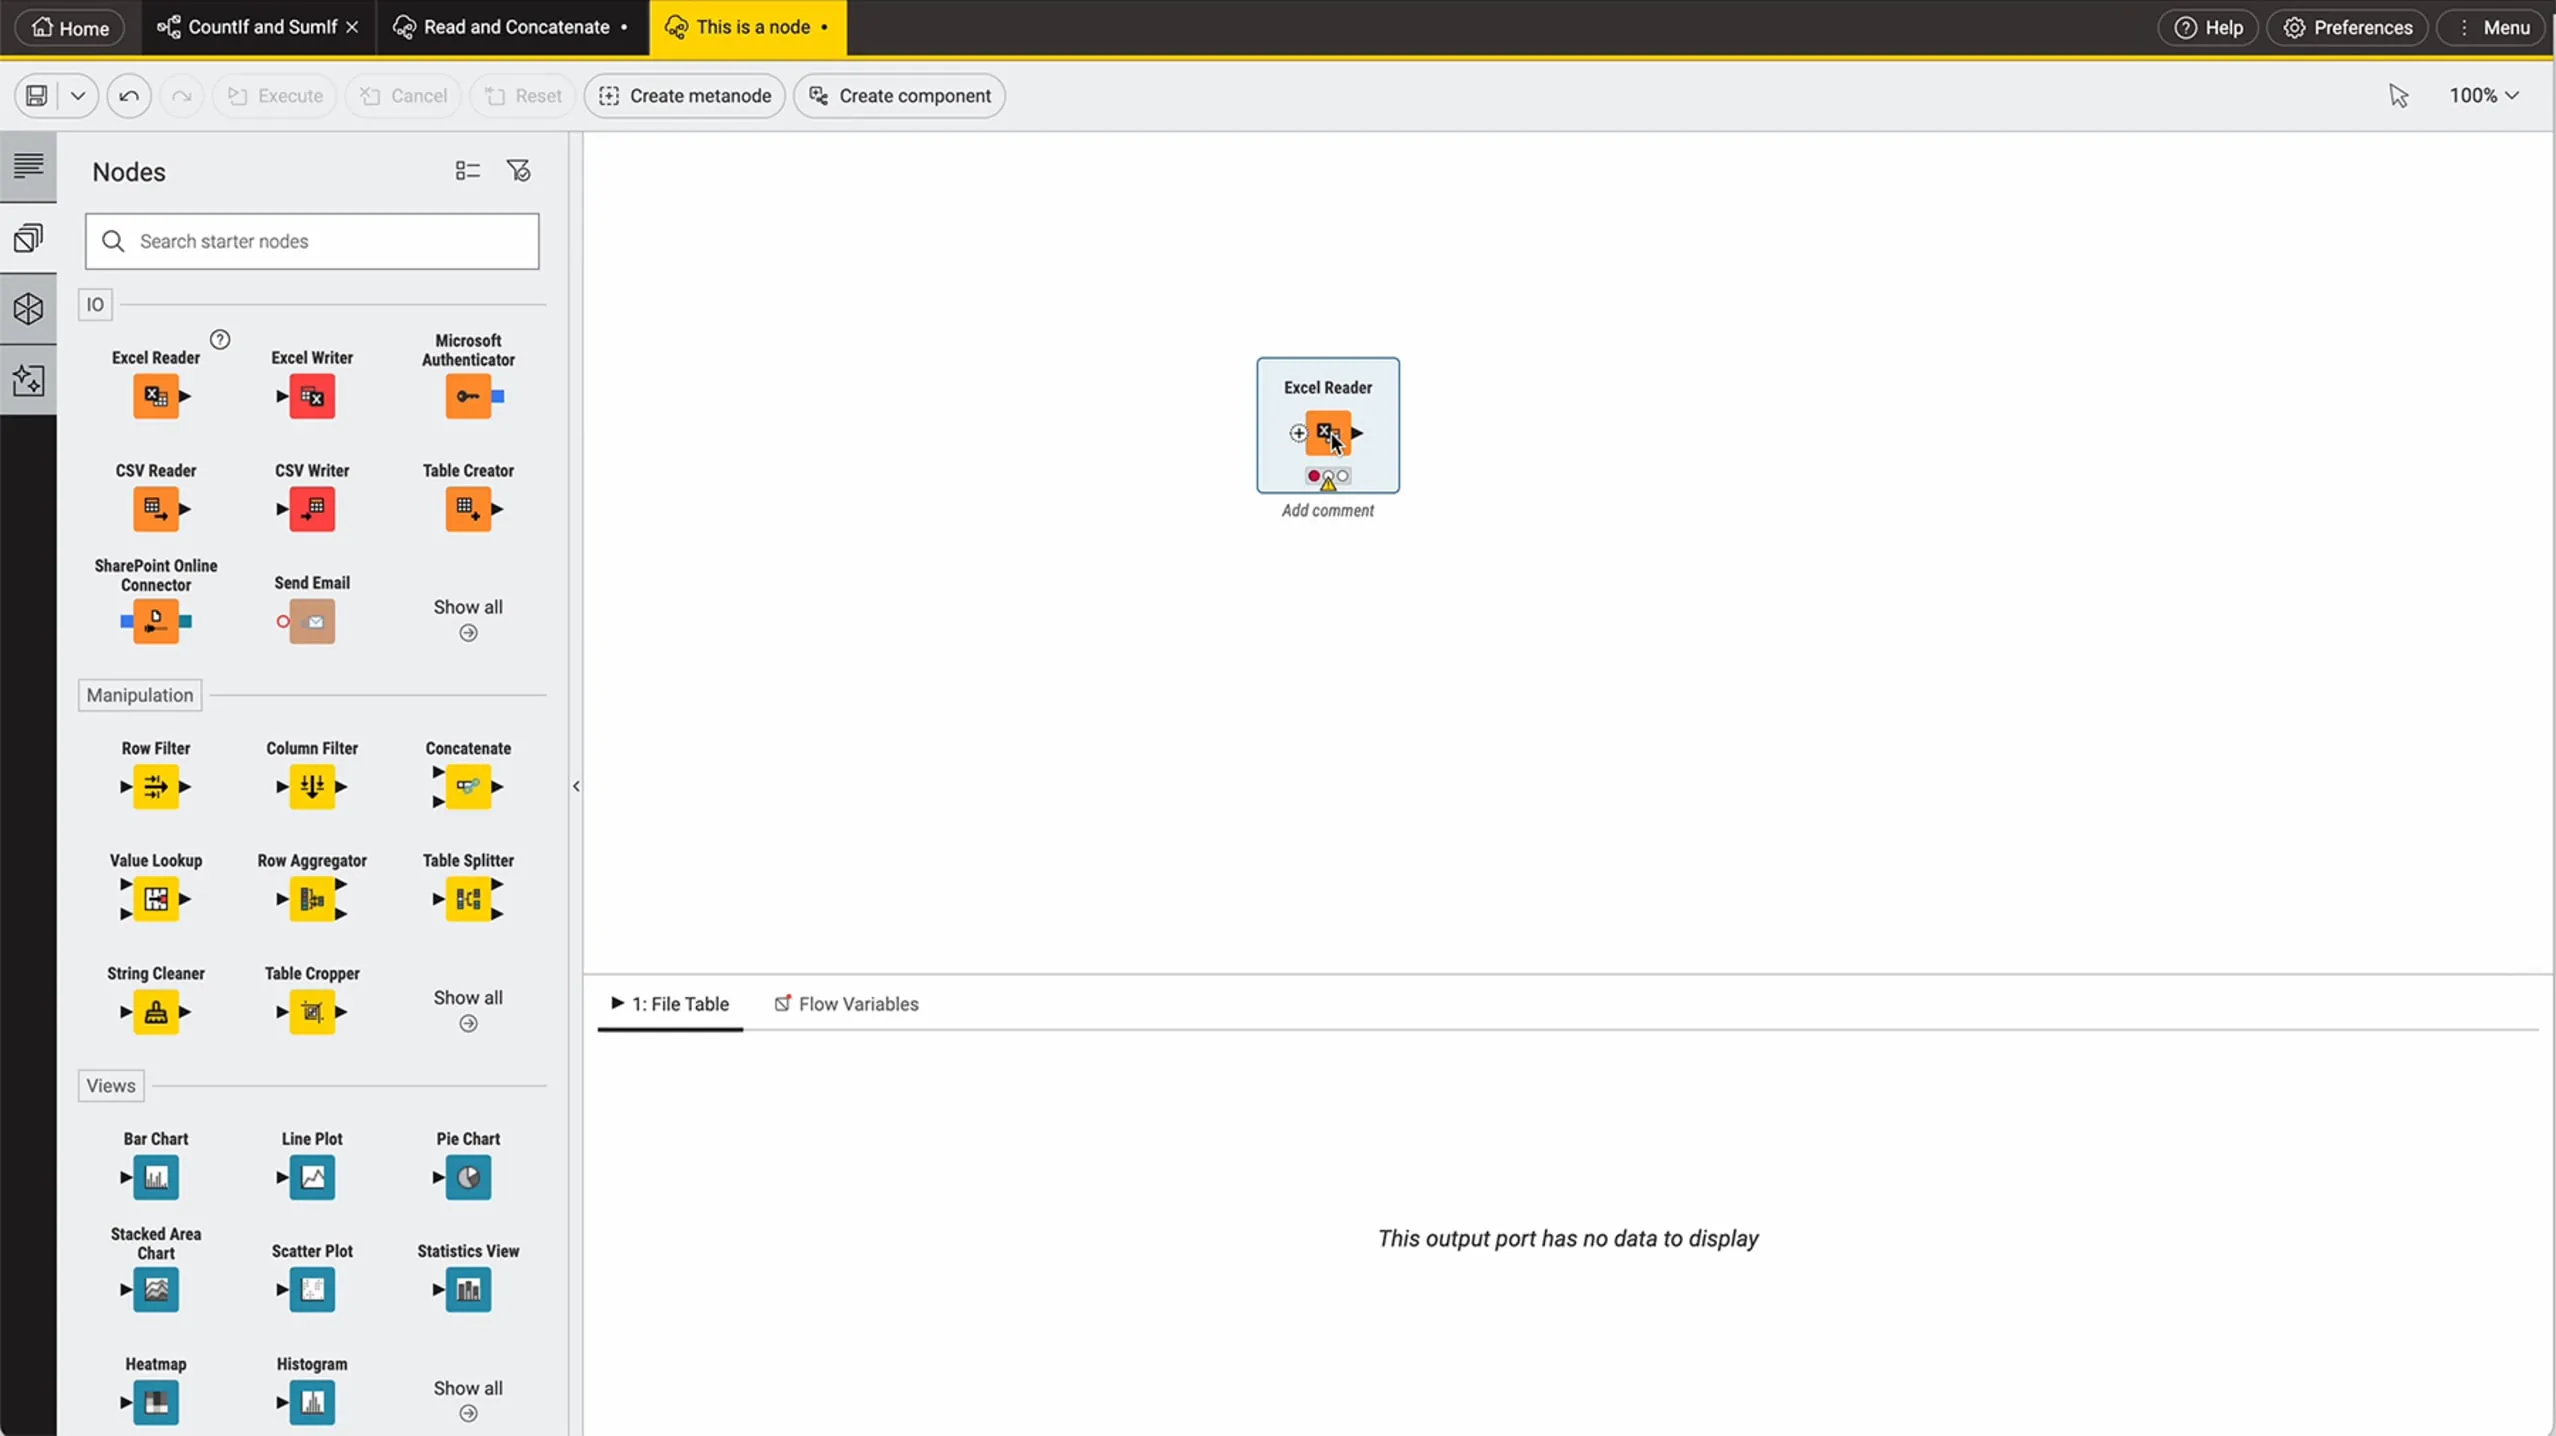
KNIME’s architecture centers on a visual workflow builder for designing data-science solutions. Users work with workflows and reusable components rather than being limited to isolated analyses. This matters operationally because reusable components create a mechanism for carrying a repeatable analytical pattern into another workflow, but the trade-off is that teams must establish standards for component ownership, naming, review, and lifecycle management if they want reuse to remain understandable at scale.

  • Blend & Transform: KNIME states that it can access any data type from any source through more than 300 connectors. This is the platform’s principal data-access claim and gives teams a broad connector surface when constructing workflows. The evidence does not name individual connectors or document connector-specific capabilities, so architects should validate the sources and authentication patterns central to their environment before standardizing on KNIME.

  • Model & Visualize: The platform offers a complete range of analytic and AI methods and models. In the workflow model, this positions modeling and visualization as parts of a single data-science solution rather than separate handoffs between tools. The breadth claim is valuable, but KNIME does not provide a supported list of methods, model versions, or comparative model-quality results in the provided data, so it should not be read as evidence for a particular machine-learning technique.

  • Deploy & Monitor: KNIME describes a secure process for deploying data-science solutions and monitoring them through a standard process. For data leaders, standardization is the key architectural benefit: a designed workflow can be treated as something to put into production rather than an analyst’s one-off artifact. Security controls, monitoring signals, deployment targets, and operational service levels are not described here, which is a limitation for regulated or production-critical evaluations.

  • Consume & Interact: The product claims enterprise-scale consumption and interaction through cloud-native architecture. That direction is relevant for organizations planning to make analytics available beyond their initial creators. However, no cloud provider support, tenancy model, concurrency limit, or infrastructure requirement is provided, so “cloud-native” should be validated in a technical architecture review rather than accepted as a sizing commitment.

  • Get started: KNIME explicitly frames onboarding as a route into advanced analytics and making sense of data. Combined with the visual workflow builder, this supports its citizen-data-scientist positioning. The cost is that a low-code visual surface does not eliminate the need for disciplined data definitions, testing practices, access control, and accountability for production outputs.

The repository data adds one technical fact: Java is the primary language. That is relevant to teams assessing the product’s technical lineage, but it does not prove compatibility with their own Java stack or define the languages users need for workflow development. KNIME’s public repository showed a last push on 2026-07-29, which indicates a dated public activity point only; it does not establish release cadence, support responsiveness, or future roadmap commitments.

Ideal Use Cases

KNIME fits a corporate citizen-data-science program in which engineers or analysts need a structured route from beginner work to analytical practice. The supplied customer statement says engineers went from complete beginners to analytics practitioners within a few months. For a data leader building internal capability, the visual workflow format and reusable-component emphasis give training cohorts a tangible way to produce shared artifacts rather than disconnected exercises.

A second appropriate scenario is a small data or analytics engineering team that needs to blend and transform varied sources before applying analytical or AI methods. KNIME’s stated support for more than 300 connectors provides a starting point for evaluating source coverage, while the workflow builder gives the team a common representation for the process. We would require a connector proof of concept for the team’s critical data sources, because the supplied information does not identify which connector handles which source or what operational constraints apply.

A third fit is an organization that wants to move a data-science solution from creation into a standardized deployment and monitoring process. KNIME directly positions deployment and monitoring as part of the product, and its enterprise-scale, cloud-native consumption claim indicates that it is intended to extend beyond desktop experimentation. This is particularly relevant when the organization wants the same platform to support workflow design, deployment, and downstream interaction, though the implementation requirements must be validated before a production commitment.

KNIME is also appropriate for individuals learning advanced analytics through a free, open-source platform for personal use. The zero-cost entry point reduces the barrier to testing the visual workflow model before a team purchases collaboration or governance capabilities. That advantage has a clear boundary: free personal use should not be presented internally as equivalent to a governed organizational deployment.

Don’t use KNIME if your immediate requirement is a product with publicly documented performance numbers, confirmed named integrations, published user limits, or detailed commercial entitlement matrices. The available evidence supports KNIME’s visual workflow, connector-count, deployment, monitoring, and cloud-native positioning, but not those procurement and architecture details. Teams with strict production assurance requirements should request those facts directly and make them acceptance criteria.

Strengths & Trade-offs

KNIME’s strengths are meaningful for teams that want a visual, reusable approach to data science, but its disclosed evidence leaves several decision-critical gaps. The product is not a universal answer for every analytics organization; its value depends on whether visual workflow construction and an open-source entry point are more important than fully transparent enterprise specifications. We would assess it as a practical platform to pilot, with commercial and operational diligence required before standardization.

Pros

  • More than 300 connectors support broad workflow entry points. KNIME states that its Blend & Transform capability accesses any data type from any source through 300+ connectors. That is concrete scope for teams assessing heterogeneous data access, even though each required connector still needs validation.

  • The workflow builder supports reusable analytical assets. KNIME explicitly emphasizes designing data-science workflows and reusable components. This is more specific than generic low-code usability: teams can organize work as repeatable solutions rather than recreate the same analytical process for each request.

  • The product spans creation through deployment and monitoring. KNIME states that it supports secure deployment and monitoring through a standard process. For a team trying to reduce the gap between designing an analysis and placing a solution into production, that is a coherent lifecycle proposition.

  • The open-source Analytics Platform creates a low-cost adoption path. Personal users can use it for free, and paid options are disclosed at $19/mo, $49/mo, and $99/mo. This creates an accessible route for learning and initial product evaluation before a commercial conversation.

  • Its adoption positioning is credible for training-oriented programs. A named customer statement describes engineers moving from beginner status to analytics practitioners within a few months. That supports a targeted use case: structured citizen-data-scientist development.

Cons

  • The paid plan structure is underspecified. Although $19/mo, $49/mo, and $99/mo options are listed, the provided material supplies neither plan names nor feature-by-tier definitions. This makes direct cost-to-capability comparison difficult and requires sales validation.

  • The free tier has a material use restriction. KNIME Analytics Platform is free for personal use, not explicitly described as free for team or enterprise deployment. Organizations should avoid treating personal-use access as a substitute for governed commercial licensing.

  • Connector breadth is not connector depth. The 300+ connector claim does not identify named systems, supported operations, authentication methods, or operational constraints. A critical source-system requirement remains an unresolved implementation question until tested.

  • Production claims lack supporting operational specifics. KNIME describes secure deployment, monitoring, enterprise scale, and cloud-native architecture, but provides no performance metrics, infrastructure details, monitoring measures, or service commitments. This is weak evidence for high-assurance production selection.

  • Public repository signals are limited. The repository is primarily Java, had 0 stars, and its recorded last push was 2026-07-29. These facts are neither an enterprise-adoption measure nor a product-quality verdict, but they do not provide a strong public community-adoption signal for an evaluator seeking one.
KNIME pricing

Starting at
Free (open source)
Free access
Open source

View full KNIME pricing intelligence →

Alternatives to KNIME

The reviewed substitutes for KNIME among the data preparation tools, and what would make each one the better answer.

Direct alternatives

Reviewed substitutes: products bought for the same job, where a team picks one.

Alteryx
Choose Alteryx if you need enterprise-grade governance, workflow lineage, and a mature ecosystem of certified training, but be prepared for per-seat licensing that starts at $250 per user per month, billed annually.Applies to: Choosing the tool analysts will use to prepare and blend data without writing code.
Easy Data Transform
Two data preparation tools that build repeatable cleaning and blending workflows without code. They are compared directly on price and capability, and a team licenses one.Applies to: Choosing the tool analysts will use to prepare and blend data without writing code.

Other approaches

A different approach to the same problem. Each substitutes only for the workload named beside it.

Tableau
Choose Tableau if your primary need is visual analytics and storytelling rather than ETL or machine learning pipeline construction.Applies to: Deciding how the stack is shaped, where both products can be part of the answer.
Power BI
Choose Power BI if you need low-cost, Microsoft-integrated reporting and visualization rather than heavy data preparation workflows.Applies to: Whether data preparation happens in the BI tool or in a dedicated preparation workflow.
See detailed alternatives analysis

If you are evaluating KNIME alternatives, you are likely weighing the tradeoffs between an open-source visual analytics platform and the commercial tools that dominate enterprise BI. KNIME Analytics Platform offers a free, node-based workflow builder with 300+ data connectors and deep extensibility through R, Python, and Spark, but teams often outgrow its desktop-first architecture or need stronger collaboration, governance, and cloud-native deployment. We reviewed the leading competitors across pricing, architecture, and real-world fit to help you decide.

Top Alternatives Overview

Alteryx is the closest commercial counterpart to KNIME for drag-and-drop data preparation and advanced analytics automation. It supports over 200 built-in tools for data cleansing, blending, predictive modeling, and spatial analytics. Alteryx is trusted by 8,000+ global enterprises and holds a 49.7% market share in the Data Mining category according to 6sense. The platform reduces manual data prep time by up to 90% and can save up to 170 FTE hours per month through predictive analytics automation. Choose Alteryx if you need enterprise-grade governance, workflow lineage, and a mature ecosystem of certified training, but be prepared for per-seat licensing that starts at $250 per user per month, billed annually.

Power BI is Microsoft's BI platform and the most affordable commercial option at $9.99 per user per month for Pro licensing, with a free tier available. It integrates tightly with Microsoft 365 and Azure, making it the natural choice for organizations already in the Microsoft ecosystem. Power BI offers interactive dashboards, natural language Q&A, and paginated reporting. It is the most widely deployed BI tool on the market. Choose Power BI if you need low-cost, Microsoft-integrated reporting and visualization rather than heavy data preparation workflows.

Tableau remains the gold standard for interactive data visualization, with Explorer licenses starting at $42 per user per month and Creator licenses at $75 per user per month. Tableau's drag-and-drop canvas excels at ad hoc visual exploration, and it supports connections to virtually every data source. Now part of Salesforce, Tableau offers Tableau Cloud for SaaS deployment and Tableau Server for on-premises. Tableau commands a massive BI installed base. Choose Tableau if your primary need is visual analytics and storytelling rather than ETL or machine learning pipeline construction.

Looker is Google Cloud's semantic modeling and BI platform, acquired for $2.6 billion in 2019. Its differentiator is LookML, a code-based modeling language that defines metrics and relationships in a governed semantic layer. Looker is API-first and excels at embedded analytics, enabling teams to build custom data applications. It integrates natively with BigQuery and the broader Google Cloud Platform. Looker reviews average 8.4 out of 10 based on 457 user reviews. Choose Looker if you run on Google Cloud and want a semantic layer that enforces consistent metric definitions across the organization.

Amazon QuickSight is AWS's serverless BI service, now evolving into Amazon Quick with agentic AI capabilities. Its standout feature is pay-per-session pricing, where Reader users cost as little as $0.30 per session (capped at $5 per month), making it the most cost-effective option for large-scale embedded analytics deployments. QuickSight's SPICE engine provides fast, in-memory calculations, and the platform supports FedRAMP, HIPAA, and PCI DSS compliance. Choose QuickSight if you are on AWS and need serverless, low-cost BI with usage-based pricing for large user bases.

ThoughtSpot takes a search-driven approach to analytics, letting business users ask questions in natural language and receive AI-generated answers. Essentials starts as low as $25 per user per month billed annually, for 5 to 50 users and up to 25M rows, with Pro and Enterprise custom priced. ThoughtSpot works directly against cloud data warehouses like Snowflake and Databricks. Choose ThoughtSpot if self-service exploration through natural language is your priority and your data already lives in a modern cloud warehouse.

Architecture and Approach Comparison

KNIME operates on a desktop-first, node-based workflow paradigm. Users drag processing nodes onto a canvas, connect them to form pipelines, and execute locally. KNIME Server (now KNIME Business Hub) adds collaboration, scheduling, and deployment capabilities, but the core design philosophy starts from the analyst's desktop. This gives KNIME unmatched flexibility for prototyping complex analytics pipelines that combine data preparation, machine learning, and statistical analysis in a single workflow. KNIME's open-source core supports Java, Python, R, SQL, and Spark integration, meaning teams can embed custom code at any point.

Alteryx follows a similar visual workflow approach but is a fully commercial product. Alteryx Designer handles desktop authoring while Alteryx Server manages enterprise deployment, governance, and scheduling. Alteryx's Intelligence Suite adds AutoML and AI capabilities. The key architectural difference is that Alteryx is a closed, proprietary system, while KNIME's open-source foundation allows community-contributed nodes and extensions.

Power BI, Tableau, Looker, and QuickSight are primarily visualization and reporting platforms rather than workflow builders. Power BI uses a data model layer with DAX formulas. Tableau relies on VizQL, its visual query language. Looker pushes query logic to the database through LookML. QuickSight runs queries through its SPICE in-memory engine or directly against data sources. None of these tools replicate KNIME's ability to build multi-step data science pipelines with branching logic, model training, and iterative processing within a single visual canvas.

ThoughtSpot's architecture is fundamentally different, built around a search index over your cloud warehouse. It pre-indexes relationships in your data so users can type questions and get instant answers. This makes it excellent for consumption but not suited for the pipeline-building work that KNIME handles.

Pricing Comparison

KNIME Analytics Platform is free and open source for personal use. KNIME lists paid offerings for collaboration, governance, and scale:

OfferingDisclosed price and terms
ProStarts at $19/month or €19/month for individuals automating workflows built in KNIME Analytics Platform. The plan includes 120 workflow-runtime credits; additional runtime is listed at $0.025 or €0.025 per vCore minute.
TeamStarts at $99/month or €99/month for small businesses with fewer than 50 employees. It includes three team members, with additional team members listed at $49/month or €49/month.
KNIME Business HubPricing is available on request for teams with business needs and enterprises.

The supplied pricing information identifies monthly starting prices for Pro and Team, but does not state whether those starting prices are per user or per team. Buyers evaluating Business Hub should request pricing for their required deployment, execution capacity, support, and licensing terms.

When to Consider Switching

Switch from KNIME to Alteryx when your team needs enterprise-grade workflow governance, certified training programs, and dedicated customer success management. Alteryx's ecosystem includes SOC 2, ISO, and GDPR compliance certifications that matter for regulated industries. The tradeoff is a starting cost of approximately $250 per user per month versus KNIME's zero-cost entry point.

Switch from KNIME to Power BI or Tableau when your primary bottleneck is dashboard creation and data visualization rather than data pipeline construction. KNIME can produce charts, but it was built for workflow orchestration, not interactive reporting. Power BI at $9.99 per user per month or Tableau at $15 per user per month for Viewers will deliver polished, shareable dashboards faster.

Switch from KNIME to Looker when you need a governed semantic layer that enforces metric consistency across your entire organization, especially if you run on Google Cloud. Looker's LookML modeling approach prevents the definition drift that happens when multiple KNIME workflows compute the same metric differently.

Switch from KNIME to QuickSight when you are building embedded analytics at scale on AWS and need serverless infrastructure with pay-per-session economics. KNIME Server requires provisioning and managing infrastructure, while QuickSight scales automatically.

Switch from KNIME to ThoughtSpot when you want to empower business users with natural language data exploration without training them on workflow construction. ThoughtSpot's search interface requires zero technical skill from end users.

Migration Considerations

KNIME workflows do not have a direct export path to any of these alternatives. Each migration requires rebuilding logic in the target platform's native format. For teams moving to Alteryx, the transition is relatively straightforward because both tools use a visual workflow paradigm, though node mappings are not one-to-one. Expect to recreate data preparation steps, joins, and transformations manually in Alteryx Designer.

Migrating to a BI platform like Power BI, Tableau, or Looker means fundamentally rethinking your architecture. KNIME workflows that combine data preparation and visualization need to be split: move data preparation logic into a dedicated ETL tool or SQL transformations, then connect the BI platform to the cleaned data. This separation often improves maintainability but requires additional infrastructure planning.

For QuickSight migrations, data preparation logic from KNIME workflows should move into AWS Glue, Step Functions, or another AWS-native orchestration service. QuickSight then connects to the prepared datasets in S3 or Redshift.

KNIME's Python and R integration nodes can ease the transition. Export your custom logic as standalone Python or R scripts first, then integrate those scripts into whatever target platform you choose. This preserves your analytical logic even as the orchestration layer changes.

Budget for a 2-4 month migration timeline for small teams with under 50 workflows, and 6-12 months for enterprise deployments with hundreds of production workflows. Factor in revalidation time, as every migrated workflow needs testing to confirm output parity with the original KNIME implementation.

Public signals

About these signals

Verified factual signals from public sources. They indicate observable activity or interest, not total adoption, product quality, or cost.

0 GitHub commits 90d0 GitHub stars0 vulnerabilities across 1 package

See all signals from 7 sources
Source
Signals
Last updated
GitHub
Commits 90d:0Stars:0
September 21, 2026
Docker Hub
Pulls:15.1k↑10
September 21, 2026
PyPI
Weekly downloads:54↑16
September 21, 2026
Google Trends
Search interest:Top 36%overallTop 29%in Business Intelligence
September 21, 2026
Product Hunt
Comments:1Reviews:0Votes:1
September 21, 2026
Stack Overflow
Questions:301
September 21, 2026
OSV
Package vulnerabilities:0 vulnerabilitiesacross 1 package

PyPI · knime@0.11.6

September 21, 2026
KNIME product dashboard and interface

Frequently asked questions

Is KNIME free?

Yes, the KNIME Analytics Platform desktop application is completely free under the GPL license with no restrictions. The paid options KNIME publishes are its hosted plans at $19, $49 and $99 per month; server and enterprise deployments are quoted.

How does KNIME compare to Alteryx?

KNIME is free with 5,000+ nodes. Alteryx costs $250/user/month on its Starter Edition, with 300+ tools and better UX. KNIME provides similar capabilities at zero cost; Alteryx provides a more polished experience at premium pricing.

Can KNIME do machine learning?

Yes, KNIME includes built-in nodes for classification, regression, clustering, neural networks, and deep learning. It also integrates with TensorFlow, Keras, H2O, and Python ML libraries.

Related Data Preparation Tools

Other data preparation tools in the catalog. Same kind of product, not a substitution recommendation.