Decision comparison
KNIME vs Power BI
KNIME is a strong open source data science platform for building advanced analytics workflows with machine learning and GenAI, while Power BI is a prominent self-service business intelligence platform with interactive dashboards and close Microsoft ecosystem integration.
Use-case verdict
Choose KNIME for analytical workflows; choose Power BI for dashboards and reporting
KNIME is built around visual workflows for data access, transformation, analysis, modeling, and automation. Power BI is centered on self-service business intelligence, semantic models, reports, and dashboards. They can also work together when KNIME prepares or models data that Power BI presents.
Pick KNIME when
analysts or data scientists need reusable visual workflows for preparation, advanced analytics, machine learning, or automation.
Pick Power BI when
business users need governed reporting, interactive dashboards, DAX models, and deep Microsoft ecosystem integration.
Use both when
KNIME handles complex preparation or modeling and Power BI distributes the resulting metrics and dashboards.
Architecture choice. These take different approaches to the same problem. Read the table as a fit question rather than a feature race.
These are different kinds of product — Data Preparation Tool and BI Platform.
Quick Comparison
| Decision factor | KNIME | Power BI |
|---|---|---|
| Best For | Data scientists and analysts building advanced analytics workflows with visual node-based automation | Business users and teams needing interactive dashboards with deep Microsoft 365 ecosystem integration |
| Pricing Model | KNIME Analytics Platform free for personal use; $19/mo, $49/mo, and $99/mo paid options available | A free account is available. Power BI Pro $14.00 per user per month and Power BI Premium Per User $24.00 per user per month, both paid yearly. Power BI Embedded is priced by capacity. |
| Core Approach | Visual node-based workflow builder for data blending, modeling, and deploying analytic pipelines | Drag-and-drop report canvas with DAX formulas and Power Query for self-service BI and visualization |
| Data Connectivity | 300+ connectors to databases, cloud services, file formats, and external APIs for data ingestion | OneLake data hub unifying disparate sources with native connectors to Azure, Dynamics 365, and Excel |
| AI Capabilities | Built-in ML and GenAI nodes including LLM integration for automated workflow generation | Copilot AI generates reports from natural language, writes DAX queries, and creates data summaries |
| Deployment | Desktop-first with Business Hub for enterprise collaboration, cloud-native scaling, and REST API deployment | Cloud-native Power BI Service with Microsoft Fabric integration for enterprise-scale capacity management |
KNIME
- Best For:
- Data scientists and analysts building advanced analytics workflows with visual node-based automation
- Pricing Model:
- KNIME Analytics Platform free for personal use; $19/mo, $49/mo, and $99/mo paid options available
- Core Approach:
- Visual node-based workflow builder for data blending, modeling, and deploying analytic pipelines
- Data Connectivity:
- 300+ connectors to databases, cloud services, file formats, and external APIs for data ingestion
- AI Capabilities:
- Built-in ML and GenAI nodes including LLM integration for automated workflow generation
- Deployment:
- Desktop-first with Business Hub for enterprise collaboration, cloud-native scaling, and REST API deployment
Power BI
- Best For:
- Business users and teams needing interactive dashboards with deep Microsoft 365 ecosystem integration
- Pricing Model:
- A free account is available. Power BI Pro $14.00 per user per month and Power BI Premium Per User $24.00 per user per month, both paid yearly. Power BI Embedded is priced by capacity.
- Core Approach:
- Drag-and-drop report canvas with DAX formulas and Power Query for self-service BI and visualization
- Data Connectivity:
- OneLake data hub unifying disparate sources with native connectors to Azure, Dynamics 365, and Excel
- AI Capabilities:
- Copilot AI generates reports from natural language, writes DAX queries, and creates data summaries
- Deployment:
- Cloud-native Power BI Service with Microsoft Fabric integration for enterprise-scale capacity management
Public signals
Verified factual signals only. Bars appear only for like-for-like metrics with five weekly assessments for every tool; missing evidence stays explicit. These signals do not establish enterprise adoption, product quality, or total cost.
| Metric | KNIME | Power BI |
|---|---|---|
| Docker Hub pulls(Product adoption) | 15.1k | Not available |
| GitHub commits, 90d(Developer adoption) | 0 | 0 |
| GitHub stars(Developer adoption) | 0 | 1,000+ |
| Search interest(Market interest) | 1 | 62 |
| Product Hunt comments(Community interest) | 1 | 0 |
| Product Hunt reviews(Community interest) | 0 | 0 |
| Product Hunt votes(Community interest) | 1 | 2 |
| PyPI weekly downloads(Product adoption) | 54 | Not available |
| Stack Overflow questions(Community interest) | 301 | 20.5k |
| Hacker News mentions, 90d(Community interest) | Not available | 0 |
| npm weekly downloads(Developer adoption) | Not available | 241.2k |
As of September 21, 2026 — updated weekly.
Health & risk evidence
Observed public-source checks for mapped package versions and repositories.
KNIME
September 21, 2026Package vulnerabilities
PyPI · knime@0.11.6
0 vulnerabilities
across 1 package
Repository security score
Not available
Power BI
September 21, 2026Package vulnerabilities
npm · powerbi-client@2.24.1
0 vulnerabilities
across 1 package
Repository security score
github.com/microsoft/PowerBI-JavaScript
7.4/10
Interface Preview
KNIME
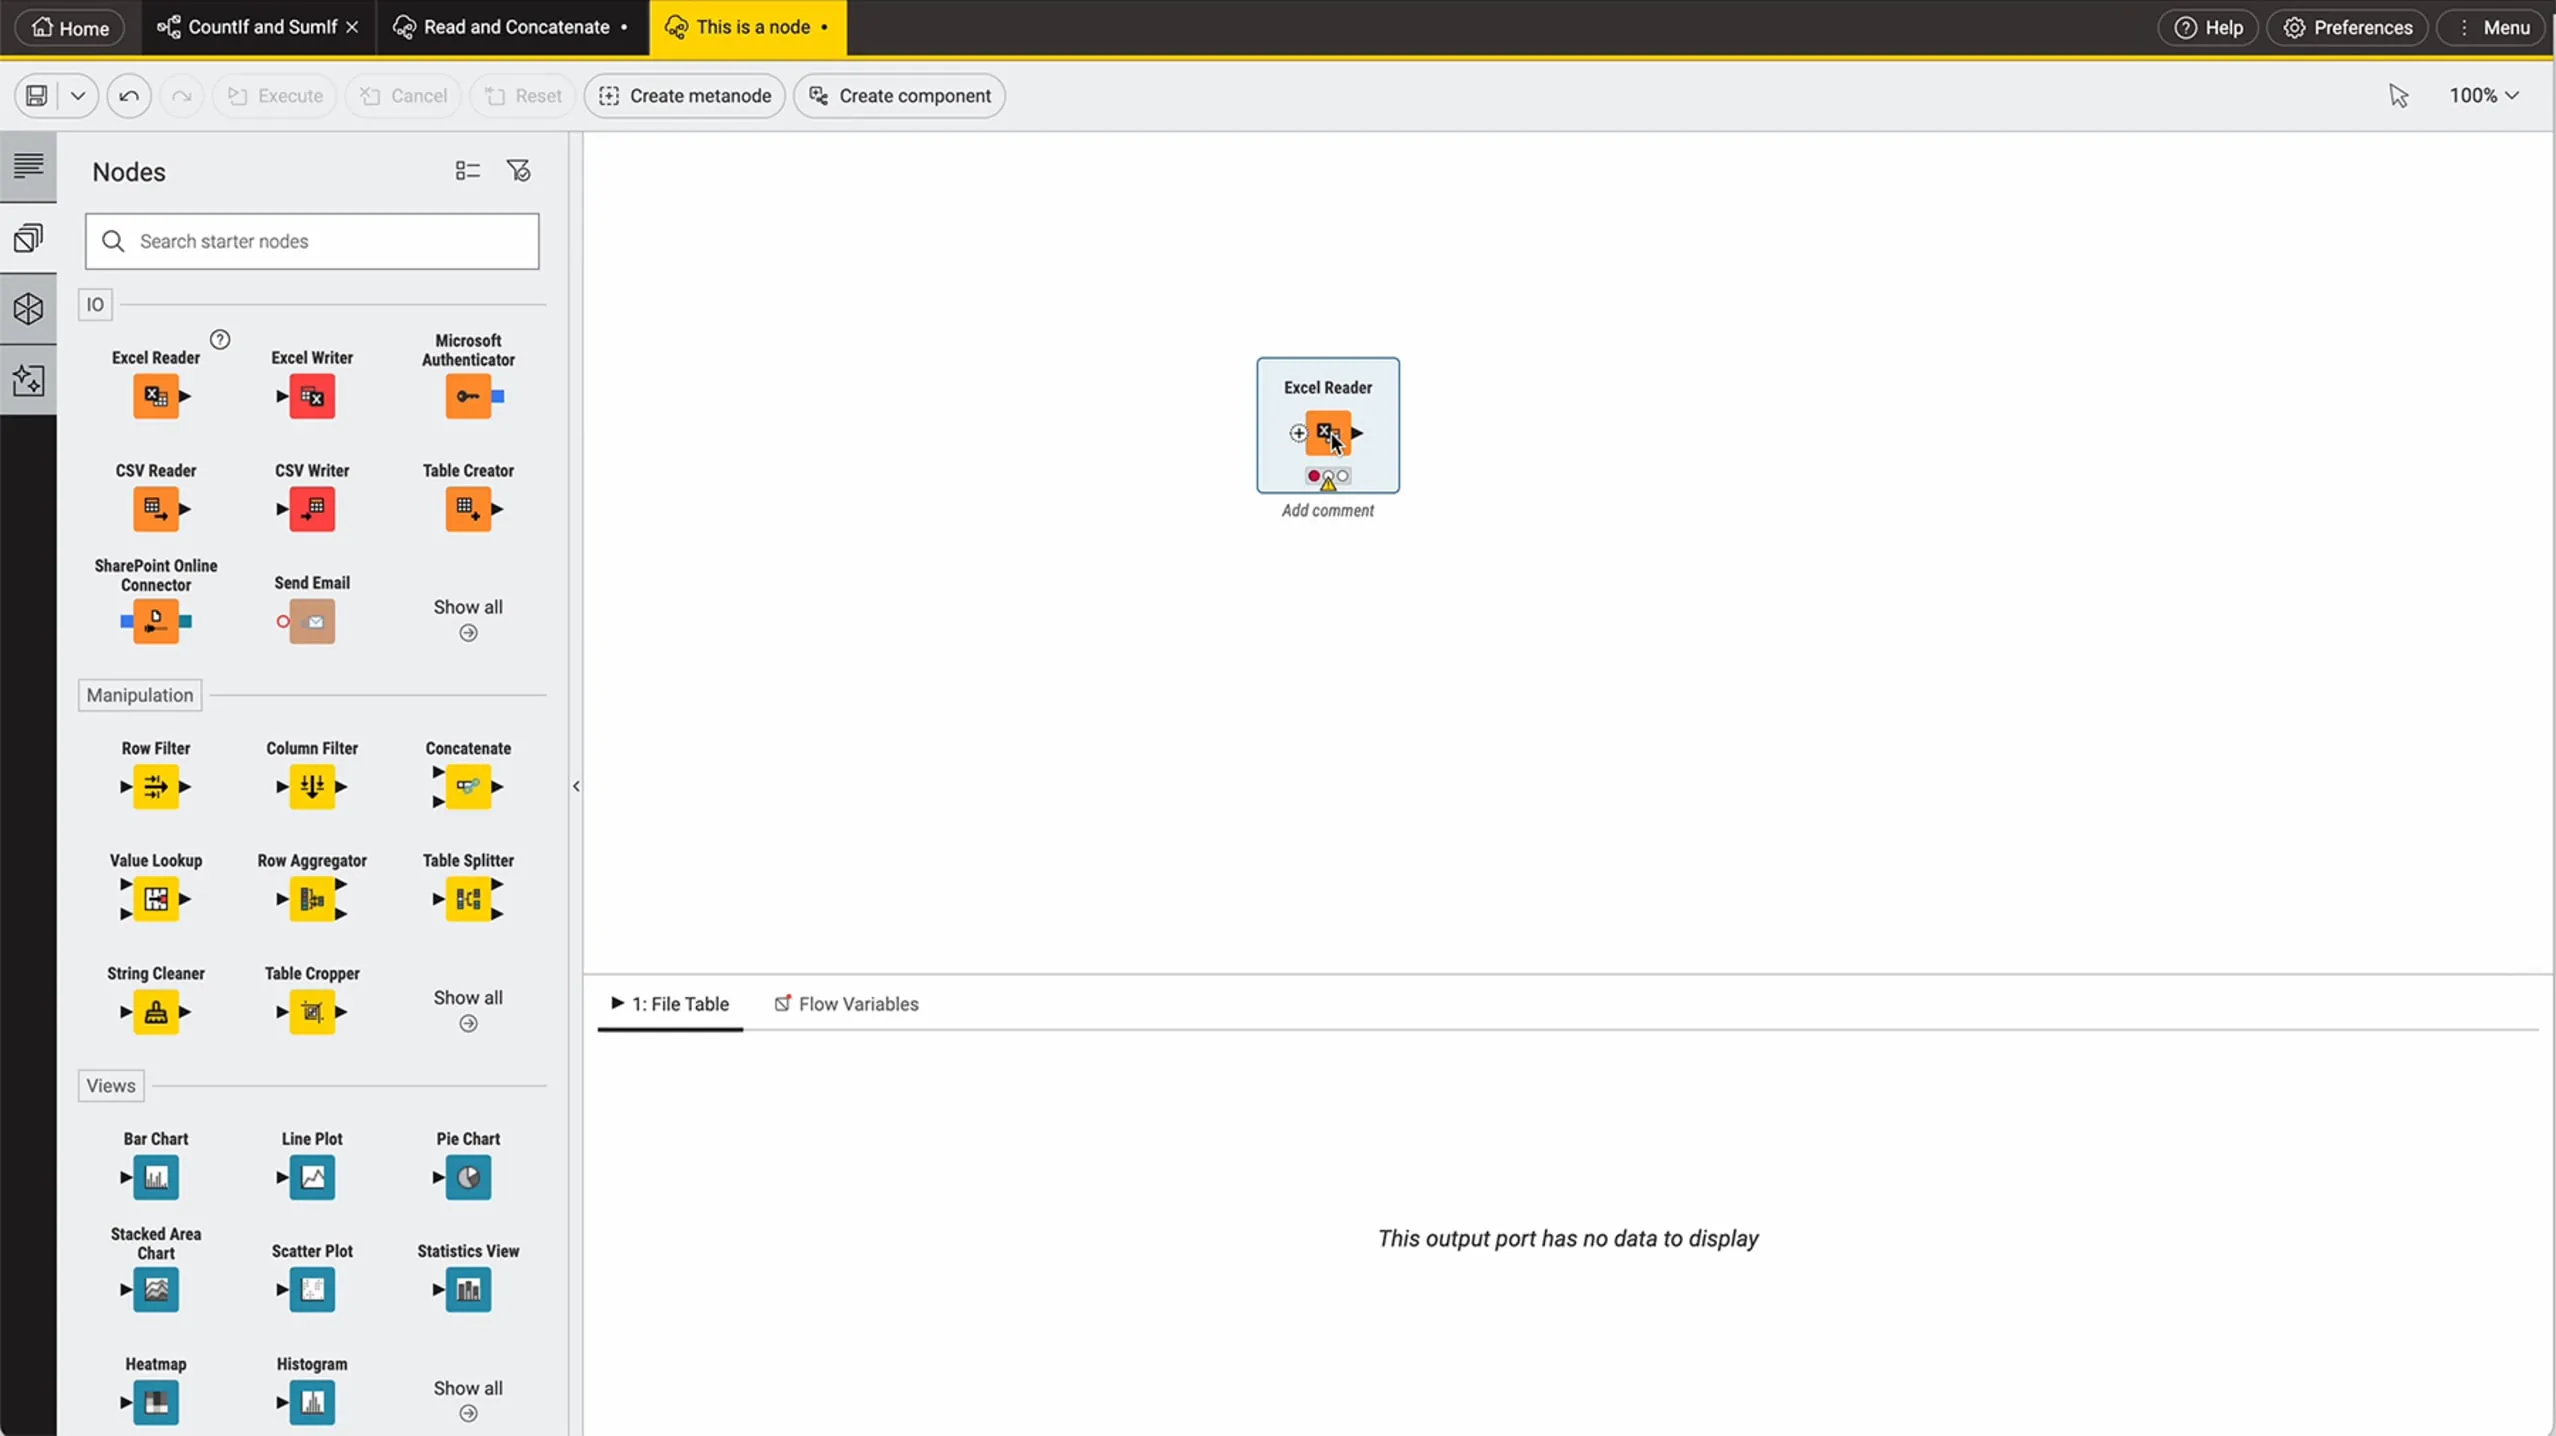
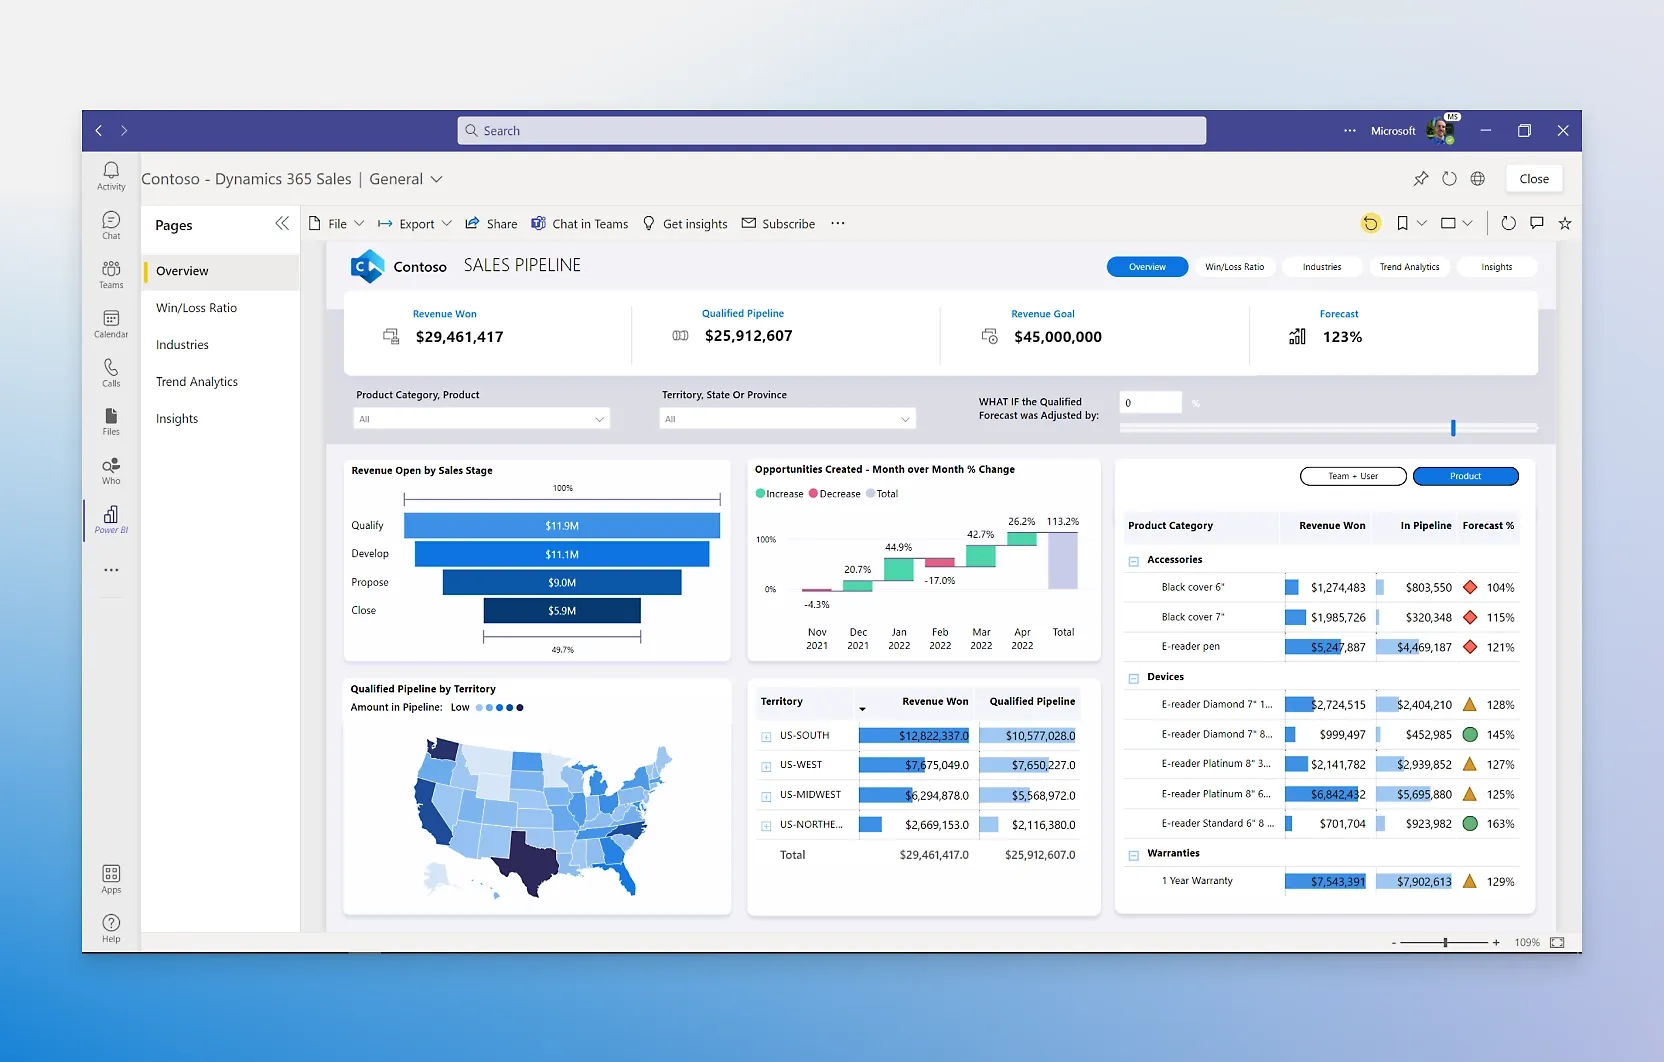
Power BI
Feature Comparison
| Feature | KNIME | Power BI |
|---|---|---|
| Data Integration | ||
| Data Source Connectors | 300+ connectors for databases, cloud, and file formats | Native connectors plus OneLake data hub for unified sources |
| Data Transformation | Visual node-based data blending and transformation pipelines | Power Query M language with graphical transformation steps |
| Real-Time Data | Automated workflow scheduling with enterprise deployment options | Streaming datasets with auto-refresh and Premium capacity scheduling |
| Analytics & Modeling | ||
| Statistical Analysis | Full range of statistical, regression, and clustering analysis nodes | DAX calculations for aggregation, time intelligence, and filtering |
| Machine Learning | Built-in ML nodes for classification, regression, and deep learning | AutoML through Azure ML integration and AI visuals |
| GenAI Integration | LLM-powered workflow generation and AI-assisted data analysis nodes | Copilot generates reports, DAX queries, and narrative summaries from prompts |
| Visualization & Reporting | ||
| Dashboard Creation | Interactive data views with dozens of configurable chart types | Drag-and-drop report canvas with hundreds of built-in and custom visuals |
| Report Sharing | Business Hub for sharing workflows and data apps across the organization | Publish to Power BI Service and embed in Teams, PowerPoint, and Excel |
| Embedded Analytics | REST API deployment for integrating analytics into external applications | Power BI Embedded for white-labeled customer-facing reports and dashboards |
| Collaboration & Governance | ||
| Team Collaboration | Version-controlled workflow sharing between data scientists and domain experts | Workspace-based collaboration with row-level security and role assignments |
| Data Governance | Centralized administration with deployment monitoring at the team level | Microsoft Purview integration for data cataloging and sensitivity labeling |
| Enterprise Security | Secure enterprise deployment with access controls and audit capabilities | Microsoft governance, security, and compliance with end-to-end visibility |
| Platform & Ecosystem | ||
| Extensibility | Open source with Java-based extensions and community-contributed nodes | Power Platform integration with Power Apps, Power Automate, and Dynamics 365 |
| Cloud Integration | Cloud-native Business Hub architecture supporting scalable enterprise deployment | Deep Azure integration with Microsoft Fabric for unified data estate |
| Learning Curve | Visual workflow builder designed for beginners to reach proficiency within months | Familiar Microsoft interface with free training resources and guided learning paths |
Data Integration
Data Source Connectors
Data Transformation
Real-Time Data
Analytics & Modeling
Statistical Analysis
Machine Learning
GenAI Integration
Visualization & Reporting
Dashboard Creation
Report Sharing
Embedded Analytics
Collaboration & Governance
Team Collaboration
Data Governance
Enterprise Security
Platform & Ecosystem
Extensibility
Cloud Integration
Learning Curve
Which approach fits
KNIME is a strong open source data science platform for building advanced analytics workflows with machine learning and GenAI, while Power BI is a prominent self-service business intelligence platform with interactive dashboards and close Microsoft ecosystem integration.
When each approach fits
Choose KNIME if:
Choose KNIME when your team needs an open source analytics platform for building complex data science workflows that go beyond visualization. KNIME is the stronger pick for organizations that require node-based pipeline automation, built-in machine learning models, and GenAI-assisted analysis. Its free Analytics Platform makes it accessible for individual data scientists, while paid plans starting at $19/mo unlock collaboration features for teams that need to share and deploy workflows at enterprise scale.
Choose Power BI if:
Choose Power BI when your organization runs on the Microsoft ecosystem and needs polished, interactive dashboards accessible to business users across departments. Power BI is the better fit for teams that prioritize self-service reporting, embedded analytics, and seamless integration with Teams, Excel, PowerPoint, and Azure. Its free Desktop app handles individual report authoring, while Pro at $14.00/user/month and Premium at $24.00/user/month deliver enterprise-grade sharing, governance, and Fabric-powered capacity scaling.
These scenarios reflect the available product evidence. Your requirements, existing stack, and team expertise should guide the final decision.
Frequently Asked Questions
Is KNIME really free to use?
KNIME Analytics Platform is free and open source for personal use. You can download it, build workflows, connect to data sources, and run machine learning models without paying anything. For team collaboration, enterprise deployment, and centralized administration, The open source core provides full analytics functionality, making the free tier substantially more capable than typical freemium offerings from commercial BI tools.
Can Power BI handle advanced data science workflows like KNIME?
Power BI is designed primarily for self-service business intelligence and interactive reporting rather than end-to-end data science pipelines. While Power BI supports AutoML through Azure ML integration and includes AI-powered visuals, it does not offer the same depth of statistical modeling, classification, or node-based pipeline orchestration that KNIME provides. Teams needing advanced analytics often pair Power BI with Azure Machine Learning or other dedicated data science tools for the modeling stage.
How does pricing compare between KNIME and Power BI for a mid-size team?
For a mid-size team, KNIME Analytics Platform is free for every user on the desktop, with Business Hub plans at $19/mo, $49/mo, or $99/mo for collaboration features. Power BI offers a free Desktop app for individual authoring, with Pro licenses at $14.00/user/month and Premium at $24.00/user/month paid yearly. The key difference is that KNIME charges per environment while Power BI charges per user, so KNIME can be more cost-effective for larger teams while Power BI stays predictable at smaller scales.
Which tool integrates better with existing enterprise systems?
Power BI has the edge for organizations deeply invested in the Microsoft ecosystem, offering native integration with Microsoft 365, Azure, Dynamics 365, Teams, Excel, PowerPoint, and Microsoft Purview for data governance. KNIME takes a more vendor-neutral approach with 300+ connectors that work across cloud providers, databases, and file formats. If your data stack is primarily Microsoft-based, Power BI delivers tighter interoperability. If you work across multiple platforms and need flexibility, KNIME provides broader connectivity without vendor lock-in.