Power BI: product and architecture
Our decision: we recommend Power BI for Microsoft-centric organizations that need governed, self-service reporting at a low entry price, but we would avoid it when a team cannot accept Microsoft platform dependence. Power BI Microsoft offers a practical mix of visual analytics, Azure alignment, and Microsoft 365 interoperability, with a free account and paid per-user options. Its strongest case is not visual novelty; it is bringing disparate data into a governed environment and distributing insights where employees already work.
Overview
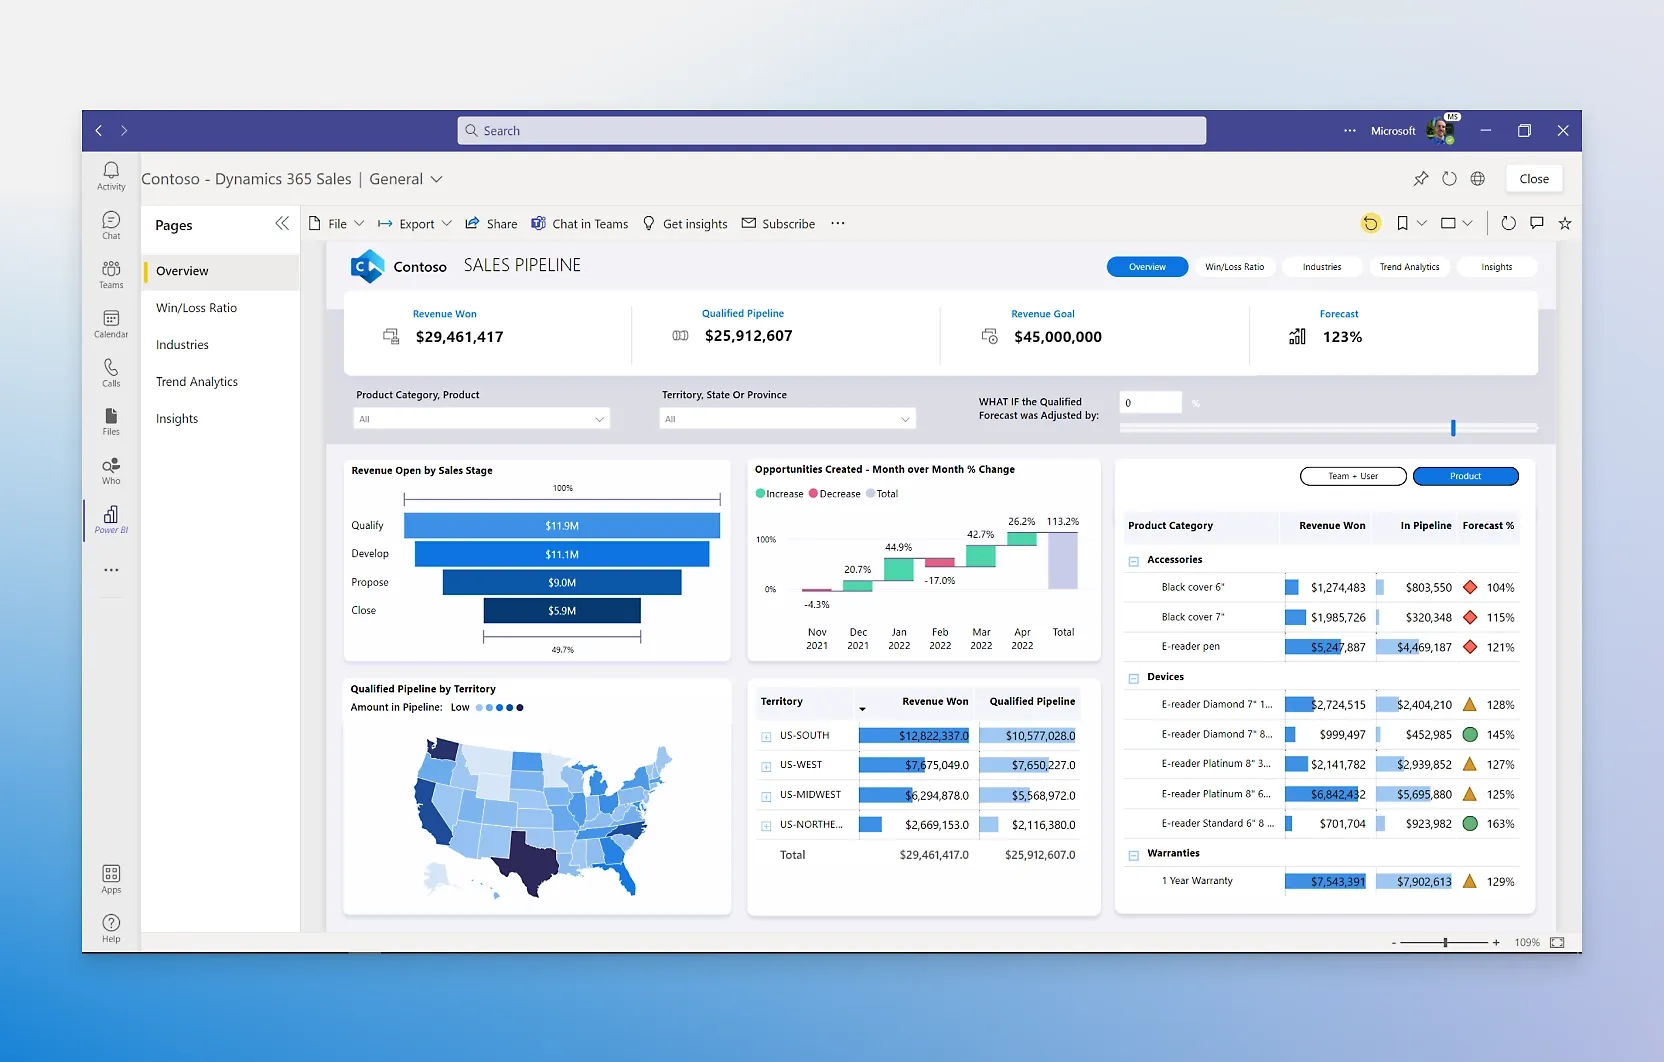
Power BI is Microsoft’s business-intelligence and data-visualization platform. It is designed to connect and visualize data, create interactive reports, and place those insights inside the applications people use every day. Microsoft positions the product around building a data-driven culture: analysts can create reports with visual analytics and advanced data-analysis tools, while broader business users consume those reports in familiar workflows.
The central architectural promise is a shared source of truth. Power BI can bring data together from disparate sources, create datasets, and add them to the OneLake data hub. That makes it a credible choice for organizations trying to reduce spreadsheet-led reporting and inconsistent metric definitions without forcing every consumer to become a data specialist.
Its market position is especially clear: Power BI is tightly integrated with Microsoft 365 and Azure, and it is part of the Microsoft Fabric story. That integration is a real operational advantage for teams already committed to Microsoft tooling. It is also the principal trade-off: the product is less attractive when your architecture and end-user environment are intentionally vendor-neutral.
Microsoft also emphasizes AI capabilities, including Copilot in Microsoft Fabric, alongside a user-friendly report-creation experience. Those capabilities may help analysts move from data to visuals faster, but they do not replace data-model governance. The platform’s value depends on whether engineering and analytics leaders establish trustworthy datasets before broad self-service access.
Key Features and Architecture
Power BI’s feature set is organized around data connection, governed datasets, self-service reporting, enterprise scale, and distribution. The product supports connecting to and visualizing data from disparate sources in the same environment. Microsoft’s stated objective is to establish a single source of truth rather than leave teams maintaining separate reporting copies.
A core architectural component is the ability to create datasets from any source and add them to the OneLake data hub. This gives data teams a shared layer for reporting inputs and creates a clearer boundary between reusable data assets and downstream visual reports. For analytics engineers, the important implication is that report creation can be standardized around governed datasets instead of allowing every business unit to define its own disconnected version of revenue, customers, or operations.
Key capabilities include:
- Data connection and visualization: Power BI connects to data and turns it into interactive visuals and reports. This is the front door for analysts who need to move from source data to reportable analysis without treating every dashboard as a custom software project.
- Governed source of truth: The platform brings disparate data sources into one environment and supports datasets in the OneLake data hub. This is valuable when metric consistency matters across finance, operations, and leadership reporting.
- Self-service plus enterprise scale: Microsoft explicitly combines enterprise-scale BI with self-service BI. That model lets central data teams define governed assets while allowing non-engineering users to explore and create within those boundaries.
- Embedded and in-workflow experiences: Power BI can infuse visuals into the apps people use every day. The stated design goal is to bridge insights and decisions rather than require users to visit a separate analytics destination for every question.
- AI-assisted analysis: Microsoft describes advanced data-analysis tools and AI capabilities, including Copilot in Microsoft Fabric. These features support report creation and insight discovery, but they should be treated as accelerators on top of validated data rather than controls for data quality.
- Accessibility and learning support: Microsoft highlights an easy-to-use interface, free training resources, and accessibility features. This lowers adoption friction for business users, though it also increases the need for a clear publishing and governance model.
The architecture is therefore strongest when teams separate responsibilities. Data engineers should own reliable source connectivity and shared data assets; analytics engineers should define reusable datasets and metric logic; business analysts should create and consume reports from those governed foundations. If everyone connects directly to whatever source is convenient, Power BI’s self-service strength becomes a governance liability.
Ideal Use Cases
Power BI is best for organizations that already use Microsoft 365 and Azure and want reporting that can be distributed through existing employee workflows. A 20-person analytics and finance organization, for example, can use shared datasets to support recurring executive reports while enabling departmental analysts to produce interactive visuals. The practical benefit is not merely dashboard creation; it is reducing the number of independently maintained reporting files and metric definitions.
It is also a strong fit for an enterprise data team that needs to combine centralized governance with local exploration. Consider a company with a central data engineering group, several analytics engineers, and analysts embedded in sales, operations, and finance. Power BI’s stated ability to unify enterprise-scale and self-service BI gives that organization a usable operating model: central teams establish the source of truth, while domain teams build reports against it.
A third scenario is a Microsoft Fabric-oriented organization that wants datasets placed in the OneLake data hub and AI capabilities available in the same broader platform context. This suits data leaders who value a consolidated Microsoft environment and want report consumption to happen inside applications users already rely on. It is particularly reasonable when adoption depends on meeting business users in existing workflows rather than asking them to learn an entirely separate analytics product.
We recommend Power BI for teams that prioritize governance, Microsoft integration, and low-cost per-user entry over platform neutrality. The free account is useful for individual evaluation and report building, while paid tiers are necessary for sharing and more advanced needs. Teams should plan licensing before rolling out broadly because publishing and sharing are explicitly associated with paid plans.
Don’t use this if your primary requirement is to avoid Microsoft ecosystem dependence or if your data strategy requires a vendor-neutral BI layer. Power BI’s Azure, Microsoft 365, Microsoft Fabric, and OneLake alignment is a strength only when that alignment matches the organization’s operating model. It is also a weak choice for teams that want unrestricted self-service without central governance, because the platform’s source-of-truth model requires deliberate stewardship.
Strengths & Trade-offs
Power BI’s advantages are meaningful, but they come with architectural and commercial constraints. In our evaluation, the product is strongest as a governed reporting layer inside a Microsoft-oriented data estate rather than as a universally neutral BI choice.
Pros
- Clear Microsoft ecosystem alignment: Power BI is tightly integrated with Microsoft 365 and Azure, which can reduce workflow friction for organizations already standardized on those environments.
- Governance is a first-class product objective: The ability to connect disparate sources in one environment and create a source of truth through datasets and the OneLake data hub is directly relevant to metric consistency.
- Self-service is paired with enterprise scale: Microsoft explicitly positions the product as combining enterprise-scale and self-service BI, giving central data teams a way to enable business users without abandoning governance.
- Low barrier to initial evaluation: A free account requires no credit card and supports rich, interactive visual reports. This makes it easy to test report-authoring fit before a broader rollout.
- Defined path for internal publishing: Power BI Pro supports publishing and sharing reports, while Premium Per User adds larger model sizes and more frequent refreshes for named users.
- Multiple distribution models: Internal report sharing and customer-facing embedded analytics are both addressed, with Power BI Embedded available through variable, contact-sales pricing.
Cons
- Microsoft lock-in is substantial: Tight integration with Azure, Microsoft 365, Microsoft Fabric, and OneLake is a benefit for aligned organizations but a material constraint for teams pursuing a vendor-neutral stack.
- Free-tier collaboration is constrained: The free account supports report creation, but upgrading to Pro or Premium is required to share reports. This can make licensing a rollout dependency rather than an afterthought.
- Sharing is behind the paid licence: the free account creates reports but cannot share them, so any collaborative use starts at Pro at $14.00 per user per month paid yearly.
- Self-service creates governance pressure: Power BI empowers broad data exploration, but that only produces reliable outcomes when teams define and maintain governed datasets. The tool cannot itself resolve inconsistent source data or unclear metric ownership.
- Enterprise capabilities are user-licensed: Premium Per User licenses specific users for enterprise-scale features. This is a deliberate licensing boundary that leaders must map to actual analyst and consumer roles.