Decision comparison
Dynatrace vs Elastic Observability
Dynatrace and Elastic Observability are both enterprise-grade and both can run inside your own environment, which already sets them apart from most of the field. They differ on where the intelligence sits. Dynatrace automates discovery and proposes causal root causes, buying back operator time on large estates. Elastic gives you a powerful query engine and a stack that also serves search and security, and expects your engineers to do the analysis.
Architecture choice. These take different approaches to the same problem. Read the table as a fit question rather than a feature race.
Applies to: full-stack monitoring workloads with AI, automation, and application-security requirements
All 2 are observability platforms.
Quick Comparison
| Decision factor | Dynatrace | Elastic Observability |
|---|---|---|
| What it is | An enterprise platform built around automatic discovery and causal AI analysis | Observability on the Elasticsearch stack, shared with enterprise search and security analytics |
| How topology is known | OneAgent discovers processes and dependencies automatically and keeps the map current | Built from the telemetry you send and the service maps you configure |
| Root cause | Davis AI proposes a causal root cause rather than a list of correlated alerts | Correlated views and dashboards; the analysis is the engineer's |
| Language coverage | Automatic instrumentation for Java, Python, Node.js, Go and .NET without code changes | APM agents and OpenTelemetry for Java, Python, Node.js, Go and .NET |
| Deployment | SaaS or Dynatrace Managed inside your environment, across AWS, GCP and Azure | Self-hosted on Docker or Kubernetes, or Elastic Cloud on AWS, GCP and Azure |
| Log handling | Log analytics integrated with the topology and the AI analysis | Full-text search over logs, a core strength of the inverted index |
| Cost model | Enterprise licensing on hosts and consumption units, usually annual | Open-source-licensed components with paid tiers, or Elastic Cloud priced on resources |
Dynatrace
- What it is:
- An enterprise platform built around automatic discovery and causal AI analysis
- How topology is known:
- OneAgent discovers processes and dependencies automatically and keeps the map current
- Root cause:
- Davis AI proposes a causal root cause rather than a list of correlated alerts
- Language coverage:
- Automatic instrumentation for Java, Python, Node.js, Go and .NET without code changes
- Deployment:
- SaaS or Dynatrace Managed inside your environment, across AWS, GCP and Azure
- Log handling:
- Log analytics integrated with the topology and the AI analysis
- Cost model:
- Enterprise licensing on hosts and consumption units, usually annual
Elastic Observability
- What it is:
- Observability on the Elasticsearch stack, shared with enterprise search and security analytics
- How topology is known:
- Built from the telemetry you send and the service maps you configure
- Root cause:
- Correlated views and dashboards; the analysis is the engineer's
- Language coverage:
- APM agents and OpenTelemetry for Java, Python, Node.js, Go and .NET
- Deployment:
- Self-hosted on Docker or Kubernetes, or Elastic Cloud on AWS, GCP and Azure
- Log handling:
- Full-text search over logs, a core strength of the inverted index
- Cost model:
- Open-source-licensed components with paid tiers, or Elastic Cloud priced on resources
Public signals
Verified factual signals only. Bars appear only for like-for-like metrics with five weekly assessments for every tool; missing evidence stays explicit. These signals do not establish enterprise adoption, product quality, or total cost.
| Metric | Dynatrace | Elastic Observability |
|---|---|---|
| GitHub commits, 90d(Developer adoption) | 275 | 423 |
| GitHub stars(Developer adoption) | 220 | 271 |
| Search interest(Market interest) | 4 | 0 |
| Hacker News mentions, 90d(Community interest) | 4 | 0 |
| PyPI weekly downloads(Developer adoption) | 20.2k | Not available |
| Stack Overflow questions(Community interest) | 199 | 3.7k |
As of September 14, 2026 — updated weekly.
Health & risk evidence
Observed public-source checks for mapped package versions and repositories.
Dynatrace
September 14, 2026Package vulnerabilities
PyPI · oneagent-sdk@1.5.2.20260107.153442
0 vulnerabilities
across 1 package
Repository security score
Not available
Elastic Observability
Package vulnerabilities
Not available
Repository security score
Not available
Interface Preview
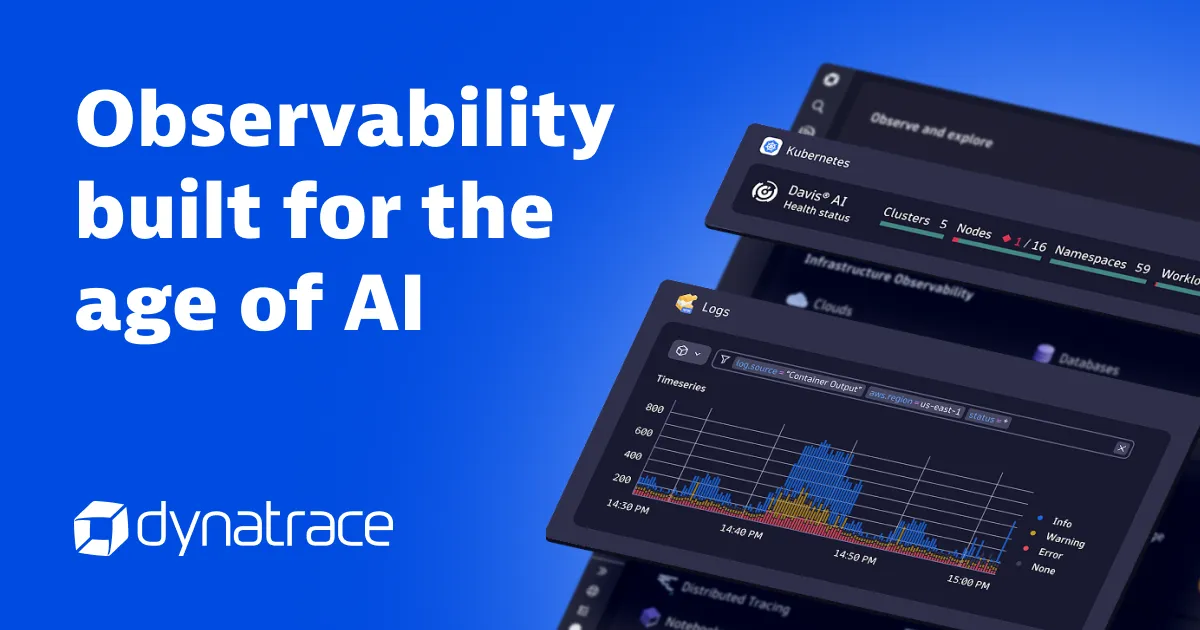
Dynatrace
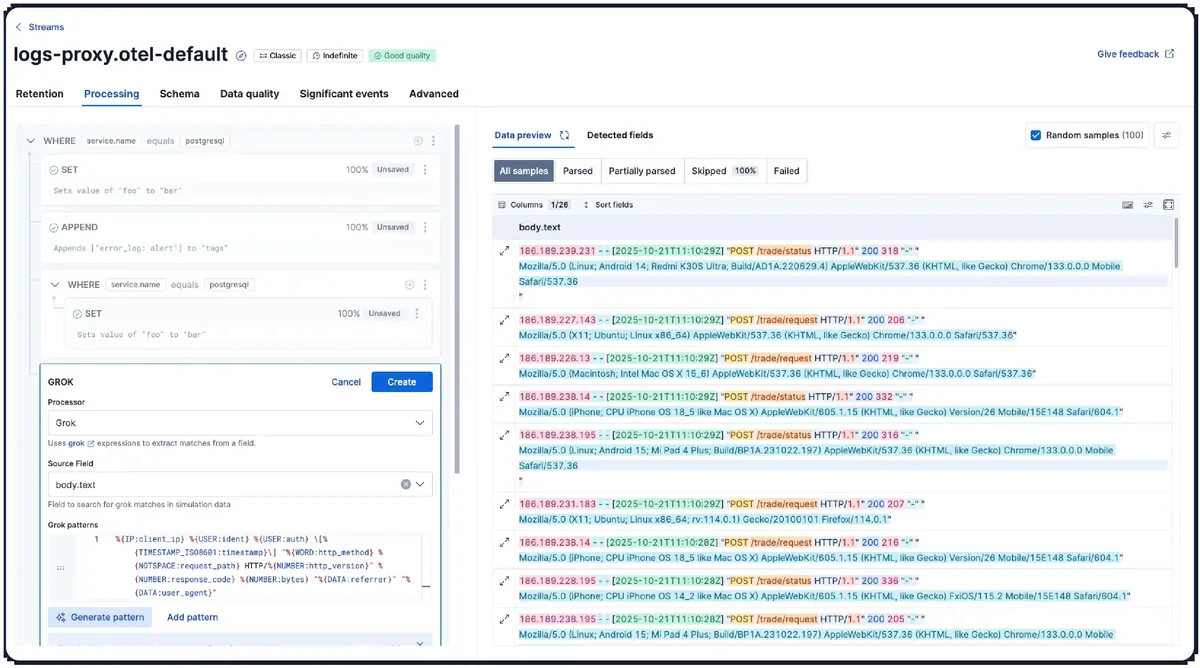
Elastic Observability
Feature Comparison
| Feature | Dynatrace | Elastic Observability |
|---|---|---|
| Telemetry | ||
| Distributed tracing | Full support | Full support |
| Metrics and dashboards | Full support | Full support |
| Log management | Full support | Full support |
| Full-text log search | Partial support | Full support |
| Analysis | ||
| Automatic dependency discovery | Full support | Partial support |
| Causal root cause analysis | Full support | Not verified |
| Automatic baselining | Full support | Partial support |
| Custom query language | Partial support | Full support |
| Platform | ||
| Shared stack with enterprise search | Not verified | Full support |
| Security analytics on the same data | Partial support | Full support |
| Self-hosted deployment | Full support | Full support |
| Managed cloud option | Full support | Full support |
| Commercial | ||
| Open-source licence | Not verified | Partial support |
| Enterprise support | Full support | Full support |
| Predictable cost at growing volume | Partial support | Partial support |
| Data residency under your control | Full support | Full support |
Telemetry
Distributed tracing
Metrics and dashboards
Log management
Full-text log search
Analysis
Automatic dependency discovery
Causal root cause analysis
Automatic baselining
Custom query language
Platform
Shared stack with enterprise search
Security analytics on the same data
Self-hosted deployment
Managed cloud option
Commercial
Open-source licence
Enterprise support
Predictable cost at growing volume
Data residency under your control
Which approach fits
Dynatrace and Elastic Observability are both enterprise-grade and both can run inside your own environment, which already sets them apart from most of the field. They differ on where the intelligence sits. Dynatrace automates discovery and proposes causal root causes, buying back operator time on large estates. Elastic gives you a powerful query engine and a stack that also serves search and security, and expects your engineers to do the analysis.
When each approach fits
Choose Dynatrace if:
Choose Dynatrace when the estate is large enough that nobody holds the dependency graph in their head and incident duration is a real cost. OneAgent discovers topology without being told, baselines form automatically, and Davis AI turns a twelve-service alert storm into a proposed cause. That automation is what the licence is buying, and on a sprawling estate it competes against engineer-hours rather than another subscription.
Choose Elastic Observability if:
Choose Elastic Observability when Elasticsearch is already in your organisation or when search and security analytics belong alongside observability. One cluster, one skill set and one licence covering three workloads is a genuine consolidation, and full-text search across long log retention is a capability the alternative does not match. It expects engineers who are comfortable querying.
These scenarios reflect the available product evidence. Your requirements, existing stack, and team expertise should guide the final decision.
Frequently Asked Questions
Is automatic root cause analysis trustworthy?
It is a strong hypothesis rather than an oracle, and experienced operators treat it that way. Its value is concentrated where manual analysis is hardest: deep dependency chains, many simultaneous alerts, responders unfamiliar with the failing service. On a small well-understood estate an engineer is often faster than the automation and trusts their own reasoning more, which is why estate size matters so much here.
What does Elastic's query engine give us?
Flexibility, at the cost of effort. You can ask questions nobody built a dashboard for, correlate telemetry with business data in the same cluster, and search logs as text rather than as structured fields. Teams with strong query skills get a great deal from this. Teams that want answers without writing queries get less, and that is the honest split between these two products.
Can both keep data in our own environment?
Yes, which narrows the field considerably if regulation matters to you. Dynatrace Managed runs inside your infrastructure and Elastic is self-hostable on Docker or Kubernetes. Most competitors in this category are SaaS-only, so if data residency is a hard requirement these two are among the small set that satisfy it.
How do the cost models compare?
They are not directly comparable. Dynatrace licences on hosts and consumption units, typically annually, which makes cost predictable and the entry price high. Elastic splits between open-source-licensed components you self-host and paid tiers or Elastic Cloud, which makes the entry price low and the total depend on how much of the commercial capability you need and who runs the cluster. Model both at your own scale.
Which is faster to get running?
Dynatrace, usually. Deploying OneAgent produces a populated topology and useful baselines without configuration, which is the point of the design. Elastic requires you to plan the cluster, configure ingestion and build dashboards — more work, and more control over the result. If time to first insight matters, that difference is measured in weeks rather than days.