Decision comparison
Amazon CloudWatch vs Azure Monitor
CloudWatch wins for AWS workloads; Azure Monitor wins for Azure workloads. The choice maps to the primary-cloud decision your organization has already made. Choose CloudWatch for AWS account-level visibility, Container Insights, composite alarms, and CloudWatch Logs Insights. Choose Azure Monitor for Azure resources, KQL log analytics, distributed tracing, and centralized diagnostics. For multi-cloud, use a third-party tool instead.
Direct comparison. These are reviewed substitutes bought for the same job, so the differences below are the ones that decide between them.
Applies to: Choosing between two products of the same kind for one job.
All 2 are cloud-native monitoring.
Quick Comparison
| Decision factor | Amazon CloudWatch | Azure Monitor |
|---|---|---|
| Best For | AWS-native observability for applications and infrastructure, with cross-account observability, Container Insights, Application Insights, and OpenTelemetry integration. | Azure-native observability with KQL log analytics, supporting end-to-end monitoring for applications, infrastructure, networks, multicloud, and hybrid resources. |
| Cloud Integration | AWS services and AWS account monitoring, including cross-account views, unified dashboards, containerized workloads, and Stream Metrics for real-time metric streaming. | Azure services and Azure resource monitoring, with Azure SLAs for Azure, multicloud, and hybrid resources, plus VM and Kubernetes monitoring. |
| Log Analysis | CloudWatch Logs and Logs Insights, with log and metrics correlation to investigate operational issues across applications and infrastructure. | Azure Monitor Logs with KQL queries, distributed tracing, centralized logs, curated visualizations, and a powerful telemetry data platform for diagnosis. |
| Alerting | CloudWatch alarms and AWS notification integrations, including composite alarms and high-resolution alarms for performance, availability, and security monitoring. | Azure Monitor alerts and Azure action groups, with near-real-time alerts and autoscaling capabilities when resource load increases. |
| Pricing | Free tier with published allowances: 10 custom or detailed-monitoring metrics, 1 million API requests (excluding GetMetricData, GetInsightRuleReport and GetMetricWidgetImage, which are always charged), 5 GB of Logs data, 3 custom dashboards, 10 alarm metrics and 1,800 Live Tail minutes per month. Paid usage is billed per unit, not by monthly plan: OpenTelemetry metric ingestion at $0.50 per GB including 15 months of storage, PromQL queries at $0.01 per million samples scanned, PutMetricData at $0.01 per million requests on top of metric storage, Live Tail at $0.01 per minute past the free allowance, metric centralization at $0.05 per GB after the first copy, and Database Insights Advanced mode at $0.0125 per vCPU-hour. Classic custom metrics are tiered at $0.30 per metric for the first 10,000, $0.10 for the next 240,000 and $0.05 beyond 250,000, which AWS states only inside its worked examples. Cross-account observability carries no additional charge. AWS states no up-front commitment and no minimum fee. Rates are US East (N. Virginia) and vary by region. | Billing is primarily based on the volume of data ingested into Azure Monitor. Use capacity reservation tiers to save up to 36 percent on data ingestion costs as compared to pay-as-you-go pricing. Some functionalities have additional charges. |
| Repository & License | CloudWatch Agent repository: 550 GitHub stars, Go primary language, MIT license, latest release v1.300071.0 on 2026-08-19. | ApplicationInsights-dotnet repository: 610 GitHub stars, C# primary language, MIT license, latest release v3.1.2 on 2026-05-28. |
Amazon CloudWatch
- Best For:
- AWS-native observability for applications and infrastructure, with cross-account observability, Container Insights, Application Insights, and OpenTelemetry integration.
- Cloud Integration:
- AWS services and AWS account monitoring, including cross-account views, unified dashboards, containerized workloads, and Stream Metrics for real-time metric streaming.
- Log Analysis:
- CloudWatch Logs and Logs Insights, with log and metrics correlation to investigate operational issues across applications and infrastructure.
- Alerting:
- CloudWatch alarms and AWS notification integrations, including composite alarms and high-resolution alarms for performance, availability, and security monitoring.
- Pricing:
- Free tier with published allowances: 10 custom or detailed-monitoring metrics, 1 million API requests (excluding GetMetricData, GetInsightRuleReport and GetMetricWidgetImage, which are always charged), 5 GB of Logs data, 3 custom dashboards, 10 alarm metrics and 1,800 Live Tail minutes per month. Paid usage is billed per unit, not by monthly plan: OpenTelemetry metric ingestion at $0.50 per GB including 15 months of storage, PromQL queries at $0.01 per million samples scanned, PutMetricData at $0.01 per million requests on top of metric storage, Live Tail at $0.01 per minute past the free allowance, metric centralization at $0.05 per GB after the first copy, and Database Insights Advanced mode at $0.0125 per vCPU-hour. Classic custom metrics are tiered at $0.30 per metric for the first 10,000, $0.10 for the next 240,000 and $0.05 beyond 250,000, which AWS states only inside its worked examples. Cross-account observability carries no additional charge. AWS states no up-front commitment and no minimum fee. Rates are US East (N. Virginia) and vary by region.
- Repository & License:
- CloudWatch Agent repository: 550 GitHub stars, Go primary language, MIT license, latest release v1.300071.0 on 2026-08-19.
Azure Monitor
- Best For:
- Azure-native observability with KQL log analytics, supporting end-to-end monitoring for applications, infrastructure, networks, multicloud, and hybrid resources.
- Cloud Integration:
- Azure services and Azure resource monitoring, with Azure SLAs for Azure, multicloud, and hybrid resources, plus VM and Kubernetes monitoring.
- Log Analysis:
- Azure Monitor Logs with KQL queries, distributed tracing, centralized logs, curated visualizations, and a powerful telemetry data platform for diagnosis.
- Alerting:
- Azure Monitor alerts and Azure action groups, with near-real-time alerts and autoscaling capabilities when resource load increases.
- Pricing:
- Billing is primarily based on the volume of data ingested into Azure Monitor. Use capacity reservation tiers to save up to 36 percent on data ingestion costs as compared to pay-as-you-go pricing. Some functionalities have additional charges.
- Repository & License:
- ApplicationInsights-dotnet repository: 610 GitHub stars, C# primary language, MIT license, latest release v3.1.2 on 2026-05-28.
Public signals
Verified factual signals only. Bars appear only for like-for-like metrics with five weekly assessments for every tool; missing evidence stays explicit. These signals do not establish enterprise adoption, product quality, or total cost.
| Metric | Amazon CloudWatch | Azure Monitor |
|---|---|---|
| GitHub commits, 90d(Developer adoption) | 68 | 10 |
| GitHub stars(Developer adoption) | 550 | 610 |
| Search interest(Market interest) | 1 | 1 |
| Hacker News mentions, 90d(Community interest) | 2 | 0 |
| npm weekly downloads(Developer adoption) | 179.5k | 844.3k |
| Stack Overflow questions(Community interest) | 4.2k | 207 |
As of September 14, 2026 — updated weekly.
Health & risk evidence
Observed public-source checks for mapped package versions and repositories.
Amazon CloudWatch
September 14, 2026Package vulnerabilities
npm · aws-embedded-metrics@4.2.1
0 vulnerabilities
across 1 package
Repository security score
Not available
Azure Monitor
September 14, 2026Package vulnerabilities
npm · @azure/monitor-opentelemetry@1.20.0
0 vulnerabilities
across 1 package
Repository security score
Not available
Interface Preview
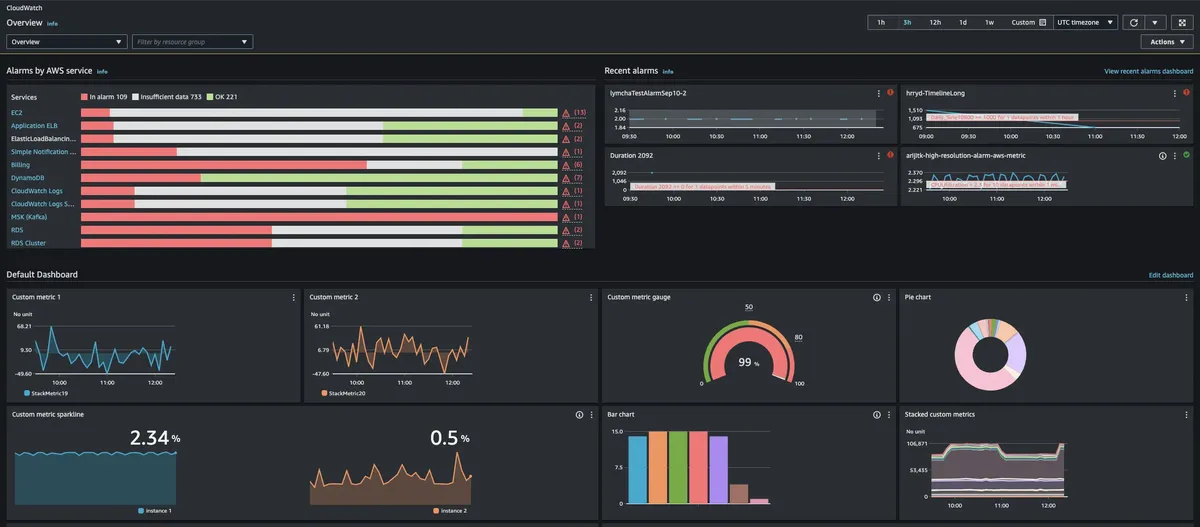
Amazon CloudWatch
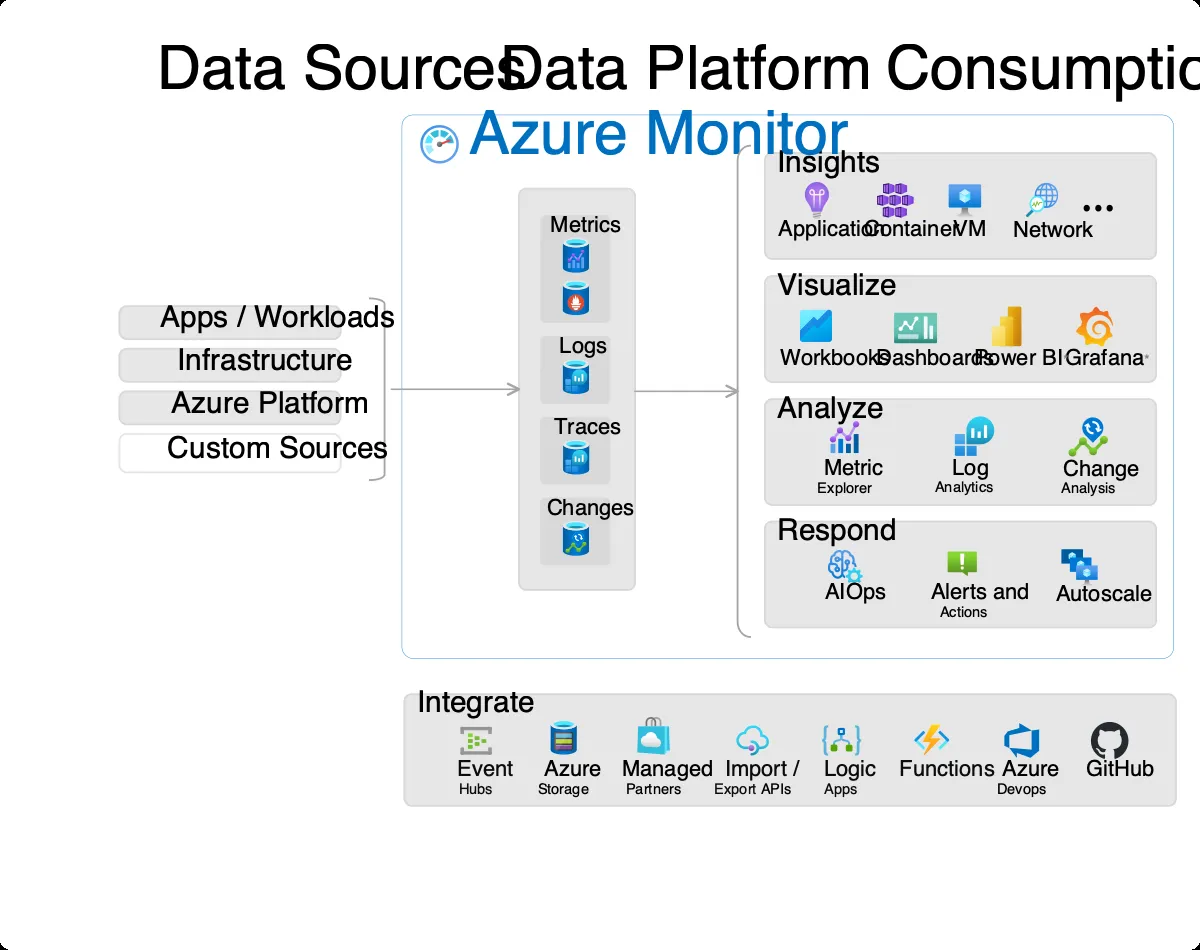
Azure Monitor
Feature Comparison
| Feature | Amazon CloudWatch | Azure Monitor |
|---|---|---|
| Cloud Integration | ||
| Primary cloud | AWS only (native) | Azure + hybrid via Azure Arc |
| Native service integration | Zero-config for all AWS services | Zero-config for all Azure services |
| Cross-account observability | Built-in via AWS Organizations | Via Azure Management Groups |
| Hybrid / on-prem | Via CloudWatch Agent on any Linux/Windows | Via Azure Arc and Azure Monitor Agent |
| Observability Capabilities | ||
| Log query language | Logs Insights (SQL-like) | KQL (more expressive) |
| APM and tracing | ServiceLens + X-Ray (fragmented) | Application Insights (integrated) |
| Container insights | Container Insights for ECS/EKS | Container Insights for AKS |
| SIEM integration | Via third-party or AWS Security Lake | Microsoft Sentinel (same workspace, native) |
| Pricing & Access | ||
| Billing model | Per metric, per GB log, per alarm, per query | Per GB ingested + retention + alerts |
| Capacity reservations | No reservation pricing | Capacity reservations up to 36% savings |
| Access control | AWS IAM native | Azure AD native, RBAC |
| Free tier | 10 metrics, 10 alarms, 5GB logs | 5 GB/month Log Analytics, 31-day retention |
Cloud Integration
Primary cloud
Native service integration
Cross-account observability
Hybrid / on-prem
Observability Capabilities
Log query language
APM and tracing
Container insights
SIEM integration
Pricing & Access
Billing model
Capacity reservations
Access control
Free tier
Which to choose
CloudWatch wins for AWS workloads; Azure Monitor wins for Azure workloads. The choice maps to the primary-cloud decision your organization has already made. Choose CloudWatch for AWS account-level visibility, Container Insights, composite alarms, and CloudWatch Logs Insights. Choose Azure Monitor for Azure resources, KQL log analytics, distributed tracing, and centralized diagnostics. For multi-cloud, use a third-party tool instead.
Best-fit scenarios
Choose Amazon CloudWatch if:
Choose Amazon CloudWatch when your primary cloud is AWS and you want zero-config native monitoring. It is especially suitable for cross-account AWS visibility, Container Insights, Stream Metrics, and composite or high-resolution alarms.
Choose Azure Monitor if:
Choose Azure Monitor when your primary cloud is Azure and you value KQL log analytics or Microsoft Sentinel integration. Use it for hybrid or multicloud resource monitoring, distributed tracing, centralized logs, near-real-time alerts, and autoscaling.
These scenarios reflect the available product evidence. Your requirements, existing stack, and team expertise should guide the final decision.
Frequently Asked Questions
Should I use both CloudWatch and Azure Monitor for multi-cloud workloads?
Generally no. Running both means two separate dashboards, alerting frameworks, and bills. For meaningful multi-cloud workloads, a third-party tool (Datadog, Grafana Cloud) covering both clouds in one surface is almost always better. Native tools are excellent within their clouds but fight you across clouds.
Can CloudWatch monitor Azure resources or vice versa?
Technically yes, but awkwardly. You can forward metrics between clouds via connectors, but the tools lose their zero-config advantage and you pay for ingestion at both ends. In practice, teams serious about multi-cloud switch to a neutral third-party tool rather than bolting connectors onto native platforms.
Which has better log analytics?
Azure Monitor's KQL is meaningfully more expressive than CloudWatch Logs Insights for complex queries. KQL supports joins, summaries, and advanced operators. CloudWatch Logs Insights is serviceable for simple queries and cheaper for ad-hoc exploration at low volumes.
How do they compare on cost for similar workloads?
For equivalent AWS-vs-Azure workloads, costs are within 20% of each other. Both bill primarily on log volume and retention. Azure Monitor's capacity reservations up to 36% savings can make it cheaper for predictable high-volume workloads. CloudWatch's granular pricing can make it cheaper for very sparse workloads.
Can I use Microsoft Sentinel with CloudWatch data?
Yes, Microsoft Sentinel supports AWS data sources via connectors. CloudTrail, CloudWatch Logs, GuardDuty, and S3 all have native connectors. For organizations standardized on Microsoft Sentinel as the SIEM, this can reduce the case for AWS-native security tooling even for AWS workloads.