Decision comparison
AppDynamics vs Grafana Cloud
AppDynamics and Grafana Cloud come from opposite traditions. AppDynamics is enterprise APM built around business transactions, with deep code-level diagnostics and automatic application topology, licensed per agent. Grafana Cloud is the managed form of an open-source stack — Grafana, Prometheus, Loki and Tempo — that many teams already run, with a free tier and the option of self-hosting the same components. One is bought as a platform; the other is adopted as a stack.
Architecture choice. These take different approaches to the same problem. Read the table as a fit question rather than a feature race.
Applies to: Metrics, logs and traces for a production estate, where the team will either run or buy an open-source stack.
All 2 are observability platforms.
Quick Comparison
| Decision factor | AppDynamics | Grafana Cloud |
|---|---|---|
| What it is | Cisco's enterprise APM platform, built around application performance and its business impact | A managed version of the open-source Grafana, Prometheus, Loki and Tempo stack |
| Origin | Designed for enterprise application monitoring, with business transaction tracking at its centre | Assembled from open-source projects, each widely used independently before the managed service existed |
| Instrumentation | AppDynamics agents for Java, Python, Node.js, Go and .NET, with automatic business transaction discovery | Prometheus exporters and OpenTelemetry for Java, Python, Node.js, Go and .NET, configured by you |
| Deployment | SaaS or on-premise, across AWS, GCP and Azure | Managed Grafana Cloud, or the same stack self-hosted on Docker or Kubernetes |
| Business context | Business transactions and their performance are first-class, linking latency to revenue-bearing flows | Dashboards you build; business framing is whatever you encode in them |
| Cost model | Enterprise licensing per agent or per host, typically annual | Usage-based on metrics series, logs and traces ingested, with a free tier |
| Exit cost | Agent-based instrumentation is specific to the platform | The same open-source stack can be self-hosted, so leaving the managed service is a migration rather than a rewrite |
AppDynamics
- What it is:
- Cisco's enterprise APM platform, built around application performance and its business impact
- Origin:
- Designed for enterprise application monitoring, with business transaction tracking at its centre
- Instrumentation:
- AppDynamics agents for Java, Python, Node.js, Go and .NET, with automatic business transaction discovery
- Deployment:
- SaaS or on-premise, across AWS, GCP and Azure
- Business context:
- Business transactions and their performance are first-class, linking latency to revenue-bearing flows
- Cost model:
- Enterprise licensing per agent or per host, typically annual
- Exit cost:
- Agent-based instrumentation is specific to the platform
Grafana Cloud
- What it is:
- A managed version of the open-source Grafana, Prometheus, Loki and Tempo stack
- Origin:
- Assembled from open-source projects, each widely used independently before the managed service existed
- Instrumentation:
- Prometheus exporters and OpenTelemetry for Java, Python, Node.js, Go and .NET, configured by you
- Deployment:
- Managed Grafana Cloud, or the same stack self-hosted on Docker or Kubernetes
- Business context:
- Dashboards you build; business framing is whatever you encode in them
- Cost model:
- Usage-based on metrics series, logs and traces ingested, with a free tier
- Exit cost:
- The same open-source stack can be self-hosted, so leaving the managed service is a migration rather than a rewrite
Public signals
Verified factual signals only. Bars appear only for like-for-like metrics with five weekly assessments for every tool; missing evidence stays explicit. These signals do not establish enterprise adoption, product quality, or total cost.
| Metric | AppDynamics | Grafana Cloud |
|---|---|---|
| GitHub commits, 90d(Developer adoption) | 0 | 244 |
| GitHub stars(Developer adoption) | 7 | 571 |
| Search interest(Market interest) | 0 | 1 |
| Hacker News mentions, 90d(Community interest) | 0 | 0 |
| npm weekly downloads(Developer adoption) | 4.1k | Not available |
| PyPI weekly downloads(Developer adoption) | 60.3k | Not available |
| Stack Overflow questions(Community interest) | 193 | Not available |
As of September 14, 2026 — updated weekly.
Health & risk evidence
Observed public-source checks for mapped package versions and repositories.
AppDynamics
September 14, 2026Package vulnerabilities
npm · appdynamics@26.7.1 · PyPI · appdynamics@26.7.1.9060
0 vulnerabilities
across 2 packages
Repository security score
Not available
Grafana Cloud
Package vulnerabilities
Not available
Repository security score
Not available
Interface Preview
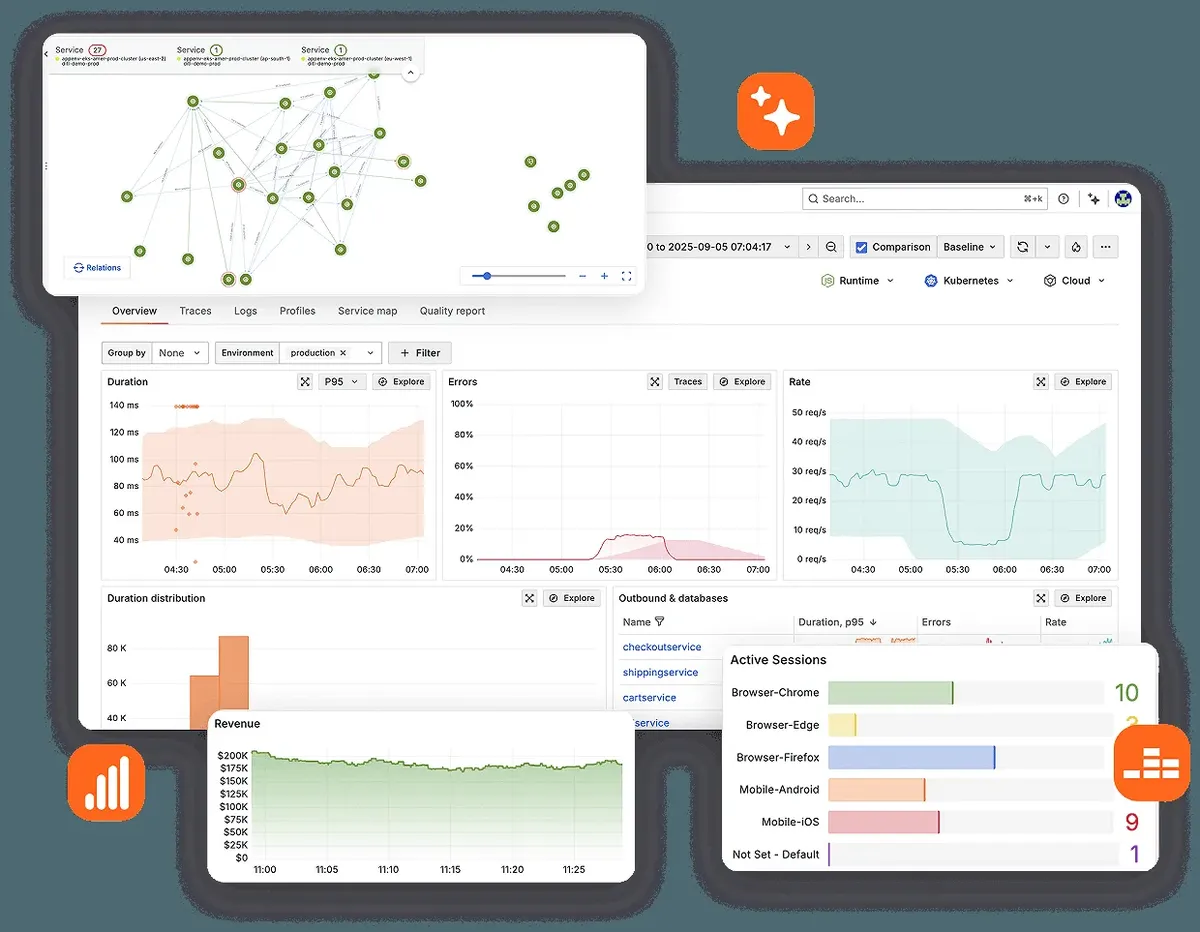
Grafana Cloud
Feature Comparison
| Feature | AppDynamics | Grafana Cloud |
|---|---|---|
| Telemetry | ||
| Distributed tracing | Full support | Full support |
| Metrics and dashboards | Full support | Full support |
| Log management | Full support | Full support |
| Real user monitoring | Full support | Partial support |
| Application focus | ||
| Business transaction tracking | Full support | Not verified |
| Automatic application topology | Full support | Partial support |
| Code-level diagnostics | Full support | Partial support |
| Database call analysis | Full support | Partial support |
| Openness | ||
| Open-source foundation | Not verified | Full support |
| Self-hostable equivalent | Partial support | Full support |
| OpenTelemetry ingestion | Partial support | Full support |
| Portable dashboards | Not verified | Full support |
| Commercial | ||
| Free tier | Not verified | Full support |
| Enterprise support | Full support | Full support |
| Predictable cost at growing volume | Partial support | Partial support |
| On-premise deployment | Full support | Full support |
Telemetry
Distributed tracing
Metrics and dashboards
Log management
Real user monitoring
Application focus
Business transaction tracking
Automatic application topology
Code-level diagnostics
Database call analysis
Openness
Open-source foundation
Self-hostable equivalent
OpenTelemetry ingestion
Portable dashboards
Commercial
Free tier
Enterprise support
Predictable cost at growing volume
On-premise deployment
Which approach fits
AppDynamics and Grafana Cloud come from opposite traditions. AppDynamics is enterprise APM built around business transactions, with deep code-level diagnostics and automatic application topology, licensed per agent. Grafana Cloud is the managed form of an open-source stack — Grafana, Prometheus, Loki and Tempo — that many teams already run, with a free tier and the option of self-hosting the same components. One is bought as a platform; the other is adopted as a stack.
When each approach fits
Choose AppDynamics if:
Choose AppDynamics when application performance in business terms is the point. Business transaction tracking measures named end-to-end flows such as checkout or login as units, code-level diagnostics and database call analysis are built in, and automatic topology keeps the application map current without anyone maintaining it. For enterprises where a performance regression carries a measurable revenue cost, that framing is what the licence is for.
Choose Grafana Cloud if:
Choose Grafana Cloud when your team already knows Grafana, Prometheus and the rest of that stack, or when you want a managed service you could walk away from. The same components self-host on Docker or Kubernetes, so the exit is a migration rather than a rewrite, dashboards are portable, and the free tier makes starting cheap. It suits infrastructure-oriented teams more than business-metric-oriented ones.
These scenarios reflect the available product evidence. Your requirements, existing stack, and team expertise should guide the final decision.
Frequently Asked Questions
What is a business transaction and why does it matter?
It is a named end-to-end flow through your application — checkout, login, search — tracked as a unit rather than as a set of service calls. AppDynamics discovers and measures these automatically, so a latency regression is reported against the named flow rather than against an individual service. For conversations with people outside engineering, that framing is the point, and reproducing it on a generic stack means encoding each flow yourself.
Is Grafana Cloud just hosted open source?
Essentially, and that is the point rather than a criticism. It runs Grafana, Prometheus-compatible metrics, Loki for logs and Tempo for traces, managed. The consequence is unusual for this market: if the commercial arrangement stops suiting you, the same components can be self-hosted on your own Kubernetes, and your dashboards come with you. Very few observability vendors offer an exit that cheap.
How do they differ on infrastructure monitoring?
Grafana Cloud is built on Prometheus, which is the conventional choice for Kubernetes and infrastructure metrics, with a large exporter ecosystem; most teams running containers already emit Prometheus metrics. AppDynamics covers infrastructure too, but its centre of gravity is the application and it is licensed as an APM product. If the estate is mostly Kubernetes and the questions are about saturation, the open stack is closer to how the data already exists.
How do the cost models differ?
AppDynamics licenses per agent or per host on an annual enterprise basis, which is predictable and has a high entry price. Grafana Cloud is usage-based on metric series, logs and traces ingested, with a free tier, so it starts near zero and grows with cardinality — and high-cardinality Prometheus metrics can grow it quickly. Neither is cheaper in general; model your own series count and host count.
Can we run both during a transition?
Yes, and it is common. Agents and exporters coexist, so you can keep AppDynamics on business-critical applications while moving infrastructure monitoring to Grafana, or run both on a subset while comparing. The duplication costs money, so treat it as a time-boxed evaluation rather than a permanent architecture.