Decision comparison
Domo vs Tableau
Domo and Tableau serve different segments of the business intelligence market. Domo is the stronger choice for organizations that need an all-in-one platform combining data integration, ETL, visualization, and collaboration in a single cloud-based environment. Tableau wins on pure visualization power, interactive exploration, and flexible deployment options with transparent per-user pricing that scales more predictably.
Direct comparison. These are reviewed substitutes bought for the same job, so the differences below are the ones that decide between them.
All 2 are BI platforms.
Quick Comparison
| Decision factor | Domo | Tableau |
|---|---|---|
| Pricing Model | Hybrid model combining per-user license fees with consumption credits. Minimum viable deployment starts at $30,000/year ($2,500/month). Small teams (10-25 users): $1,200 to $3,000/user/year ($100 to $250/month). Mid-market (50-100 users): $1,000 to $2,000/user/year. Enterprise (200+ users): $750 to $1,500/user/year. Very large (500+ users): Custom pricing. Consumption-based credits included in enterprise tiers. | Tableau Cloud Standard Edition: Viewer $15/user/month, Explorer $42/user/month, Creator $75/user/month; Enterprise Edition: Viewer $35/user/month, Explorer $70/user/month, Creator $115/user/month; Tableau+ Bundle requires contact sales for pricing details. |
| Ease of Use | Drag-and-drop dashboards with a learning curve for advanced ETL and data flows | Intuitive drag-and-drop interface recognized for strong visual best practices built in |
| Data Integration | 1,000+ pre-built cloud connectors with built-in ETL via Magic ETL and SQL DataFlows | Connects to many data sources but relies on external tools for ETL and data prep |
| Visualization | 150+ chart types and 7,000+ custom maps with mobile-first responsive design | Industry-leading interactive dashboards with drill-down and advanced analytical charts |
| Deployment Options | Cloud-only SaaS platform with optional AWS PrivateLink for enterprise security | Tableau Cloud (SaaS), Tableau Server (self-hosted), and Tableau Desktop for offline use |
| Best For | Mid-market to enterprise teams needing an all-in-one BI and data integration platform | Organizations prioritizing visual analytics and interactive dashboard exploration at scale |
Domo
- Pricing Model:
- Hybrid model combining per-user license fees with consumption credits. Minimum viable deployment starts at $30,000/year ($2,500/month). Small teams (10-25 users): $1,200 to $3,000/user/year ($100 to $250/month). Mid-market (50-100 users): $1,000 to $2,000/user/year. Enterprise (200+ users): $750 to $1,500/user/year. Very large (500+ users): Custom pricing. Consumption-based credits included in enterprise tiers.
- Ease of Use:
- Drag-and-drop dashboards with a learning curve for advanced ETL and data flows
- Data Integration:
- 1,000+ pre-built cloud connectors with built-in ETL via Magic ETL and SQL DataFlows
- Visualization:
- 150+ chart types and 7,000+ custom maps with mobile-first responsive design
- Deployment Options:
- Cloud-only SaaS platform with optional AWS PrivateLink for enterprise security
- Best For:
- Mid-market to enterprise teams needing an all-in-one BI and data integration platform
Tableau
- Pricing Model:
- Tableau Cloud Standard Edition: Viewer $15/user/month, Explorer $42/user/month, Creator $75/user/month; Enterprise Edition: Viewer $35/user/month, Explorer $70/user/month, Creator $115/user/month; Tableau+ Bundle requires contact sales for pricing details.
- Ease of Use:
- Intuitive drag-and-drop interface recognized for strong visual best practices built in
- Data Integration:
- Connects to many data sources but relies on external tools for ETL and data prep
- Visualization:
- Industry-leading interactive dashboards with drill-down and advanced analytical charts
- Deployment Options:
- Tableau Cloud (SaaS), Tableau Server (self-hosted), and Tableau Desktop for offline use
- Best For:
- Organizations prioritizing visual analytics and interactive dashboard exploration at scale
Public signals
Verified factual signals only. Bars appear only for like-for-like metrics with five weekly assessments for every tool; missing evidence stays explicit. These signals do not establish enterprise adoption, product quality, or total cost.
| Metric | Domo | Tableau |
|---|---|---|
| GitHub commits, 90d(Developer adoption) | 0 | 37 |
| GitHub stars(Developer adoption) | 125 | 716 |
| Search interest(Market interest) | 0 | 85 |
| Hacker News mentions, 90d(Community interest) | 0 | 2 |
| Product Hunt comments(Community interest) | 0 | 3 |
| Product Hunt rating(Community interest) | 5.0/5 | 4.2/5 |
| Product Hunt reviews(Community interest) | 10 | 5 |
| Product Hunt votes(Community interest) | 15 | 7 |
| PyPI weekly downloads(Developer adoption) | 56.3k | 965.7k |
| Stack Overflow questions(Community interest) | 76 | 5.4k |
| npm weekly downloads(Developer adoption) | Not available | 32.2k |
As of September 21, 2026 — updated weekly.
Health & risk evidence
Observed public-source checks for mapped package versions and repositories.
Domo
September 21, 2026Package vulnerabilities
PyPI · pydomo@0.3.0.16
0 vulnerabilities
across 1 package
Repository security score
github.com/domoinc/domo-python-sdk
2.1/10
Tableau
September 21, 2026Package vulnerabilities
npm · @tableau/embedding-api@3.16.1 · PyPI · tableauserverclient@0.41
0 vulnerabilities
across 2 packages
Repository security score
github.com/tableau/server-client-python
5.5/10
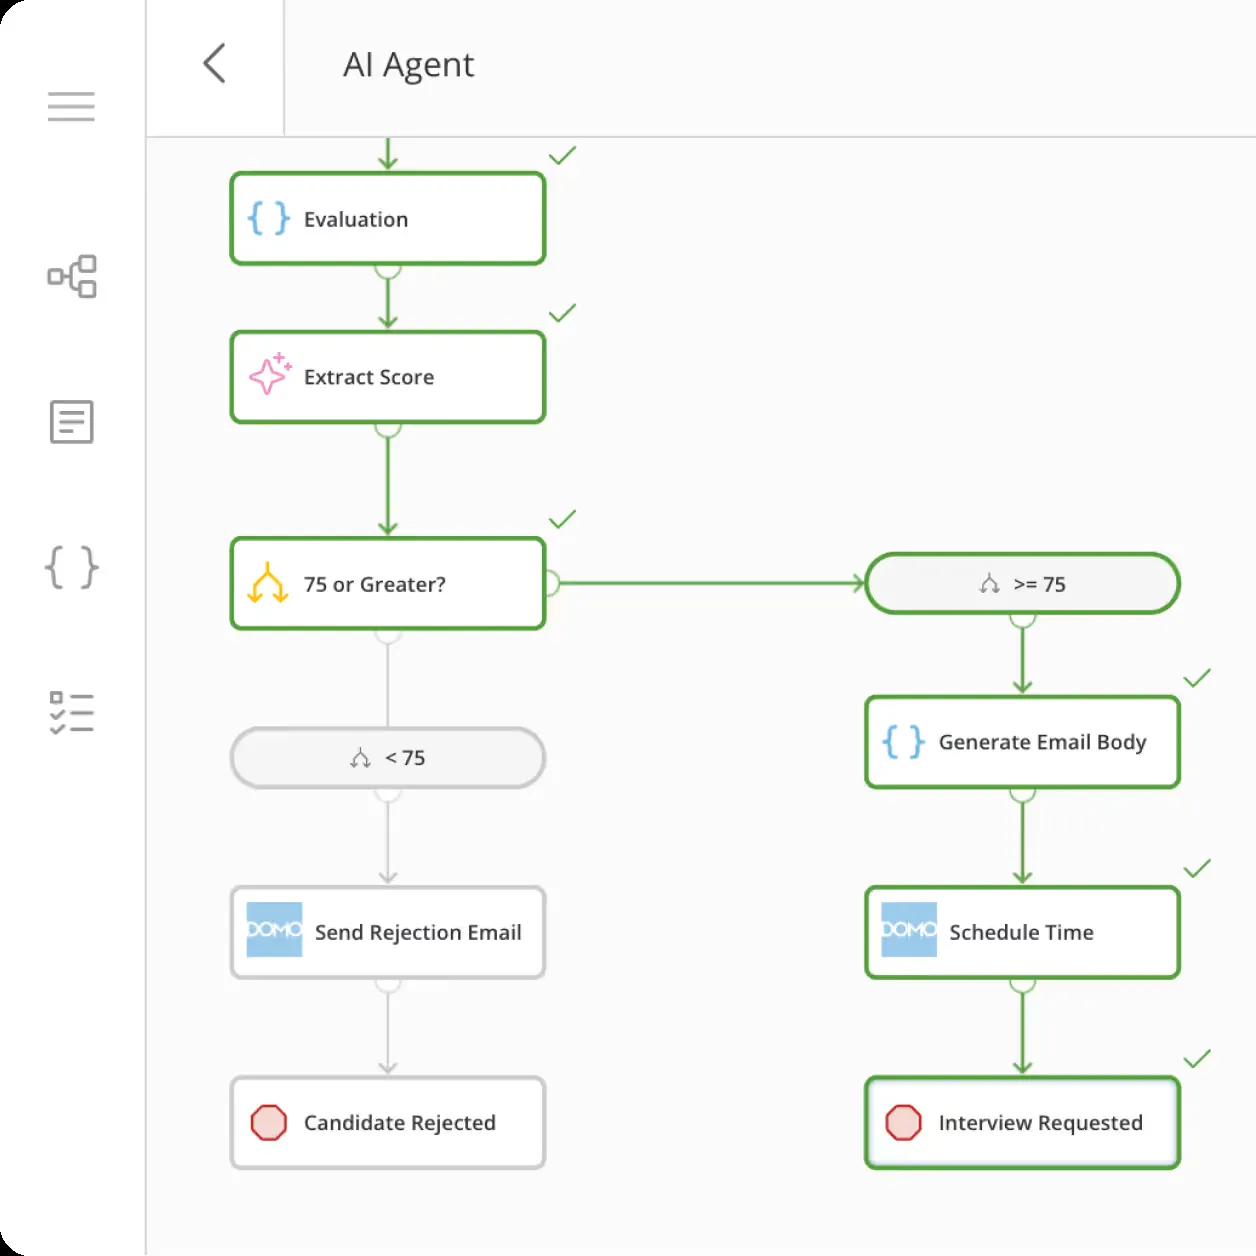
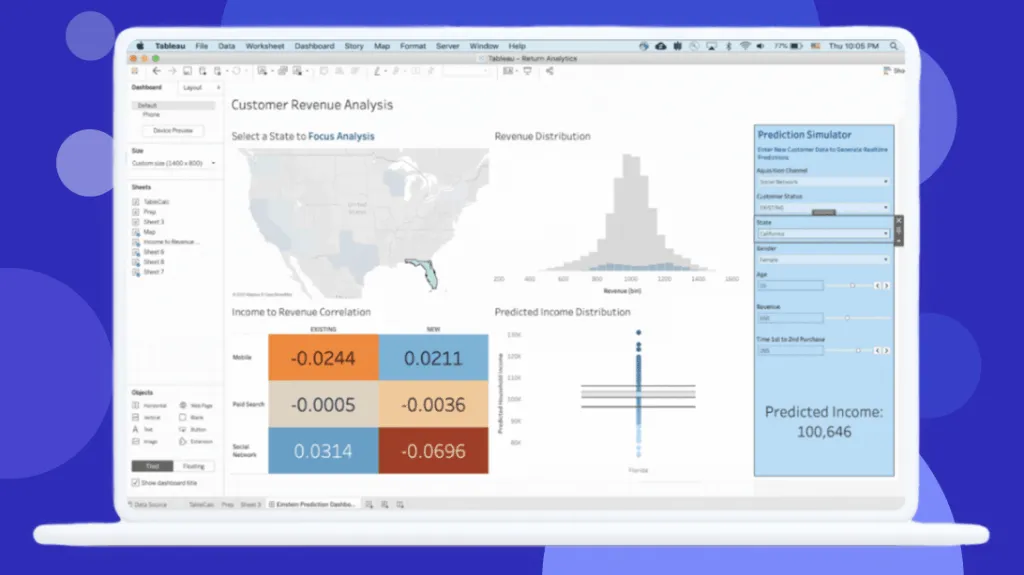
Interface Preview
Domo
Tableau
Feature Comparison
| Feature | Domo | Tableau |
|---|---|---|
| Data Integration | ||
| Pre-built Connectors | 1,000+ cloud and on-premises connectors | Broad connector library with native and partner connectors |
| Built-in ETL | Magic ETL (visual) and SQL DataFlows included | Tableau Prep Builder included with Creator license only |
| Federated Queries | Live queries to Snowflake, BigQuery, Redshift without duplication | Live connections to databases with extract scheduling options |
| Visualization & Dashboards | ||
| Chart Types | 150+ chart types with 7,000+ custom maps | Extensive chart library with advanced analytical visualizations |
| Dashboard Building | Drag-and-drop Analyzer with Beast Mode calculated fields | Drag-and-drop with built-in visual best practices and formatting |
| Mobile Experience | Mobile-first design with full-featured native app | Mobile app available with responsive dashboard layouts |
| AI & Analytics | ||
| AI Capabilities | Domo AI with AI agents, automated machine learning, and natural language queries | Agentic analytics via Agentforce integration and Tableau Next |
| Augmented Analytics | Automated data discovery and trend detection built in | AI-infused semantic layer with assisted model creation |
| Natural Language | Natural language queries for non-technical users included | Ask Data and Agentforce for conversational data exploration |
| Collaboration & Sharing | ||
| Team Collaboration | Built-in social features with comments, tags, and project management | Slack integration for permission-aware dashboard sharing |
| Embedded Analytics | Native embedded analytics with branding toolkit and SSO | Embedded analytics available with Enterprise edition licensing |
| Alerts & Notifications | Threshold-based alerts via web, email, and mobile push | Subscription alerts and Tableau Pulse for metric tracking |
| Security & Governance | ||
| Data Governance | Data lineage, certified content, governance toolkit, and sandbox environments | Enterprise-grade governance with Data 360 unified data layer |
| Compliance | HIPAA compliant environment with AWS PrivateLink on Business Critical tier | Enterprise security powered by Hyperforce on Salesforce infrastructure |
| Access Controls | Personalized row-level permissions with custom user roles and trusted attributes | Role-based licensing (Creator, Explorer, Viewer) with granular permissions |
Data Integration
Pre-built Connectors
Built-in ETL
Federated Queries
Visualization & Dashboards
Chart Types
Dashboard Building
Mobile Experience
AI & Analytics
AI Capabilities
Augmented Analytics
Natural Language
Collaboration & Sharing
Team Collaboration
Embedded Analytics
Alerts & Notifications
Security & Governance
Data Governance
Compliance
Access Controls
Which to choose
Domo and Tableau serve different segments of the business intelligence market. Domo is the stronger choice for organizations that need an all-in-one platform combining data integration, ETL, visualization, and collaboration in a single cloud-based environment. Tableau wins on pure visualization power, interactive exploration, and flexible deployment options with transparent per-user pricing that scales more predictably.
Best-fit scenarios
Choose Domo if:
Choose Domo if your organization needs a unified platform that handles data integration, ETL, dashboards, and collaboration without stitching together multiple tools. Domo works well for mid-market to enterprise teams with 50 or more users who need 1,000+ pre-built connectors, built-in Magic ETL, and mobile-first dashboards. The all-in-one approach reduces vendor management overhead, though the consumption-based credit model and $30,000/year minimum make it a significant investment that requires careful usage planning.
Choose Tableau if:
Choose Tableau if your priority is best-in-class visual analytics and interactive dashboard exploration. Tableau offers transparent per-user pricing starting at $15/month for Viewers, making it accessible for teams of any size. The platform excels at data visualization with prominent chart capabilities, supports both cloud and self-hosted deployments, and has a sizable community with over 2,300 verified reviews. Tableau requires external tools for ETL and data preparation, but its focused approach to visualization is unmatched in the BI market.
These scenarios reflect the available product evidence. Your requirements, existing stack, and team expertise should guide the final decision.
Frequently Asked Questions
How does Domo pricing compare to Tableau pricing for a mid-size team?
Domo and Tableau use fundamentally different pricing models, which makes direct comparison important. Domo uses a usage-based hybrid model with consumption credits, and the minimum viable deployment starts at $30,000/year. Tableau uses transparent per-user licensing: a team of 5 Creators ($75/mo each), 15 Explorers ($42/mo each), and 50 Viewers ($15/mo each) costs roughly $60,900/year on the Standard Cloud edition. Tableau also offers an Enterprise edition at higher per-user rates (Creator $115/mo, Explorer $70/mo, Viewer $35/mo). Domo does not publish its prices, so every contract is negotiated directly with their sales team.
Can Domo replace Tableau for data visualization needs?
Domo offers 150+ chart types and 7,000+ custom maps, which covers most standard visualization requirements. However, Tableau is widely recognized as the industry leader in visual analytics, with advanced drill-down capabilities, built-in visual best practices, and a more intuitive exploration experience. Where Domo gains an advantage is its all-in-one approach: it includes data integration with 1,000+ connectors, built-in ETL via Magic ETL and SQL DataFlows, and collaboration features that Tableau does not bundle natively. If your primary need is advanced data visualization and interactive exploration, Tableau remains the stronger choice. If you need data integration and visualization in one platform, Domo delivers more out of the box.
Which platform is easier to learn for non-technical business users?
Both platforms feature drag-and-drop interfaces, but user reviews paint a nuanced picture. Tableau earns praise for its intuitive visual interface with an 8.4/10 rating across 2,320 reviews, with users frequently citing ease of use and user-friendly design as top strengths. However, advanced calculated fields and complex analysis carry a steep learning curve. Domo scores 8.5/10 across 253 reviews, with users highlighting its ease of use and straightforward setup. Domo's all-in-one approach means users must learn data integration, ETL, and visualization within a single platform, which some users find complex. For pure dashboard consumption, both platforms are accessible to non-technical users. For building dashboards, Tableau's focused visualization tools tend to have a shorter initial learning curve.
What are the main deployment differences between Domo and Tableau?
Domo is exclusively a cloud-based SaaS platform. There is no self-hosted option, though enterprise customers can use AWS PrivateLink for secure connectivity and HIPAA-compliant environments on the Business Critical tier. Tableau offers multiple deployment options: Tableau Cloud is a fully hosted SaaS solution, Tableau Server runs on your own infrastructure (on-premises or private cloud), and Tableau Desktop provides offline authoring capabilities. This flexibility makes Tableau the better fit for organizations with strict data residency requirements or those that need self-hosted deployments. Domo's cloud-only approach simplifies infrastructure management, as there are no servers to maintain, but it limits options for organizations that cannot use public cloud platforms for regulatory or compliance reasons.