Decision comparison
New Relic vs Observe
Choose New Relic when you need a mature SaaS platform spanning APM, hybrid infrastructure, logs, distributed tracing, AI application monitoring, and a large Quickstart integration catalog. Choose Observe when your primary challenge is operating large telemetry volumes efficiently and rapidly correlating logs, metrics, and traces through a data lake, context graph, and AI SRE workflow.
Architecture choice. These take different approaches to the same problem. Read the table as a fit question rather than a feature race.
All 2 are observability platforms.
Quick Comparison
| Decision factor | New Relic | Observe |
|---|---|---|
| Best For | Teams needing broad SaaS observability across applications, infrastructure, AI workloads, cloud environments, and hybrid datacenters. | High-volume teams prioritizing fast cross-signal investigation, lower storage cost, and AI-assisted incident root-cause analysis. |
| Architecture | SaaS observability platform using agents, OpenTelemetry, distributed tracing, logs in context, and hybrid infrastructure visibility. | Streaming open data lake paired with O11y Context Graph, semantic relationships, token indexes, AI SRE, and OpenTelemetry ingestion. |
| Pricing Model | Free tier available, paid plans start at $19/mo per host, additional costs based on usage and features | Logs at $0.49, other tiers at $0.00, $0.01, $0.59 |
| Ease of Use | Users highlight setup, real-time performance monitoring, and query language; some report a learning curve and less intuitive interface. | Uses a consistent interface for logs, metrics, and traces, natural-language AI SRE investigation, and contextual drill-and-pivot workflows. |
| Scalability | Supports cloud, dedicated infrastructure, and hybrid environments with OpenTelemetry telemetry collection and AI-agent monitoring capabilities. | Built around a streaming data lake, open formats, token indexes, incremental views, and claimed 10x compression for large telemetry volumes. |
| Community/Support | Offers 780+ Quickstart integrations; user rating is 7.9/10 from 353 reviews; enterprise tier adds priority support. | Logs plan includes unlimited users; commercial engagement emphasizes demos and sales-led evaluation rather than published support-tier details. |
New Relic
- Best For:
- Teams needing broad SaaS observability across applications, infrastructure, AI workloads, cloud environments, and hybrid datacenters.
- Architecture:
- SaaS observability platform using agents, OpenTelemetry, distributed tracing, logs in context, and hybrid infrastructure visibility.
- Pricing Model:
- Free tier available, paid plans start at $19/mo per host, additional costs based on usage and features
- Ease of Use:
- Users highlight setup, real-time performance monitoring, and query language; some report a learning curve and less intuitive interface.
- Scalability:
- Supports cloud, dedicated infrastructure, and hybrid environments with OpenTelemetry telemetry collection and AI-agent monitoring capabilities.
- Community/Support:
- Offers 780+ Quickstart integrations; user rating is 7.9/10 from 353 reviews; enterprise tier adds priority support.
Observe
- Best For:
- High-volume teams prioritizing fast cross-signal investigation, lower storage cost, and AI-assisted incident root-cause analysis.
- Architecture:
- Streaming open data lake paired with O11y Context Graph, semantic relationships, token indexes, AI SRE, and OpenTelemetry ingestion.
- Pricing Model:
- Logs at $0.49, other tiers at $0.00, $0.01, $0.59
- Ease of Use:
- Uses a consistent interface for logs, metrics, and traces, natural-language AI SRE investigation, and contextual drill-and-pivot workflows.
- Scalability:
- Built around a streaming data lake, open formats, token indexes, incremental views, and claimed 10x compression for large telemetry volumes.
- Community/Support:
- Logs plan includes unlimited users; commercial engagement emphasizes demos and sales-led evaluation rather than published support-tier details.
Public signals
Verified factual signals only. Bars appear only for like-for-like metrics with five weekly assessments for every tool; missing evidence stays explicit. These signals do not establish enterprise adoption, product quality, or total cost.
| Metric | New Relic | Observe |
|---|---|---|
| GitHub commits, 90d(Developer adoption) | 303 | Not available |
| GitHub stars(Developer adoption) | 9 | Not available |
| Search interest(Market interest) | 4 | Unavailable |
| Hacker News mentions, 90d(Community interest) | 1 | 0 |
| npm weekly downloads(Developer adoption) | 894.3k | Not available |
| Product Hunt comments(Community interest) | 1 | Not available |
| Product Hunt reviews(Community interest) | 0 | Not available |
| Product Hunt votes(Community interest) | 16 | Not available |
| PyPI weekly downloads(Developer adoption) | 817.2k | 1 |
| Stack Overflow questions(Community interest) | 1.5k | Not available |
As of September 14, 2026 — updated weekly.
Health & risk evidence
Observed public-source checks for mapped package versions and repositories.
New Relic
September 14, 2026Package vulnerabilities
npm · newrelic@14.4.0 · PyPI · newrelic@13.5.0
0 vulnerabilities
across 2 packages
Repository security score
Not available
Observe
September 14, 2026Package vulnerabilities
PyPI · observe-http-sender@1.3.3
0 vulnerabilities
across 1 package
Repository security score
Not available
Interface Preview
Observe
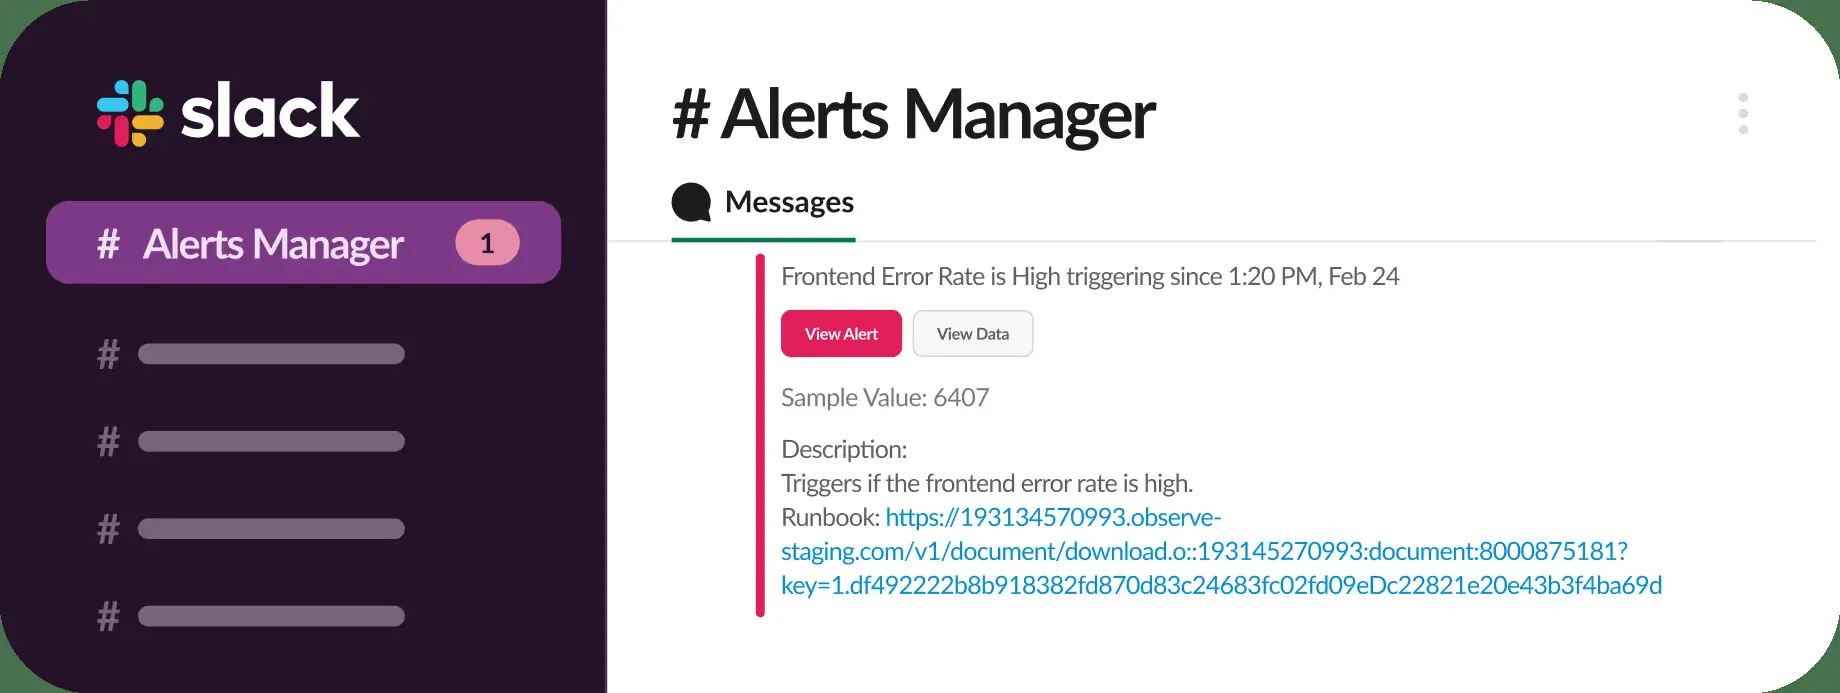
Feature Comparison
| Feature | New Relic | Observe |
|---|---|---|
| Telemetry architecture | ||
| OpenTelemetry collection | Future-proofs every telemetry signal on an open standard | Ingests OpenTelemetry data into unified observability workflows |
| Cross-signal data model | Connects logs with application and infrastructure monitoring context | Links logs, metrics, and traces through semantic context relationships |
| Storage foundation | SaaS platform monitors cloud, dedicated, and hybrid infrastructure | Streaming open data lake stores telemetry in open formats |
| AI-assisted operations | ||
| AI incident investigation | Uses intelligent observability to predict and resolve issues | AI SRE builds investigation plans and surfaces root causes |
| Automated remediation | SRE Agent moves from assistance toward automated remediation | AI SRE suggests actionable fixes after correlated investigation |
| AI application monitoring | Monitors AI application behavior and token usage automatically | Applies AI SRE to observability investigations across telemetry signals |
| Application observability | ||
| Distributed tracing | Provides distributed tracing for application transaction diagnostics | Uses OpenTelemetry-derived service maps to correlate degradation |
| Application performance monitoring | Delivers code-level diagnostics for web and mobile applications | Visualizes service dependencies through consolidated APM service maps |
| Frontend experience analysis | AI session replay identifies user friction without manual video review | Detects frontend error rates and links them to service degradation |
| Infrastructure and logs | ||
| Infrastructure monitoring | Monitors hybrid infrastructure across cloud and datacenter environments | Analyzes service pods with out-of-the-box infrastructure visualizations |
| Log analysis | Places logs in application context for faster diagnostics | Searches contextual logs without stated scale or retention constraints |
| Incident navigation | Combines monitoring signals within an intelligent observability platform | Drills and pivots across signals without observability silos |
| Scale and commercial model | ||
| Data efficiency | Usage and feature consumption contribute to paid-plan costs | Uses claimed 10x compression on low-cost cloud storage |
| User licensing | Enterprise option supports full consumption pricing without user licenses | Logs plan includes unlimited users with compute included |
| Enterprise support | Custom tier offers priority routing and one-hour critical-response SLA | Published pricing information directs buyers to request a demo |
Telemetry architecture
OpenTelemetry collection
Cross-signal data model
Storage foundation
AI-assisted operations
AI incident investigation
Automated remediation
AI application monitoring
Application observability
Distributed tracing
Application performance monitoring
Frontend experience analysis
Infrastructure and logs
Infrastructure monitoring
Log analysis
Incident navigation
Scale and commercial model
Data efficiency
User licensing
Enterprise support
Which approach fits
Choose New Relic when you need a mature SaaS platform spanning APM, hybrid infrastructure, logs, distributed tracing, AI application monitoring, and a large Quickstart integration catalog. Choose Observe when your primary challenge is operating large telemetry volumes efficiently and rapidly correlating logs, metrics, and traces through a data lake, context graph, and AI SRE workflow.
When each approach fits
Choose New Relic if:
Choose New Relic for organizations that need code-level application diagnostics, hybrid cloud/datacenter visibility, AI workload monitoring, session replay, and prebuilt integrations. It is especially appropriate when enterprise support SLAs and an established SaaS observability suite matter.
Choose Observe if:
Choose Observe for SRE and DevOps teams handling substantial telemetry volumes that want a streaming data-lake architecture, semantic cross-signal correlation, OpenTelemetry-based service maps, and AI-guided root-cause investigations with unlimited users on the published Logs plan.
These scenarios reflect the available product evidence. Your requirements, existing stack, and team expertise should guide the final decision.
Frequently Asked Questions
What is the main difference between New Relic and Observe?
New Relic is a broad SaaS observability platform focused on application performance management, distributed tracing, logs in context, hybrid infrastructure monitoring, AI application monitoring, and a catalog of more than 780 Quickstart integrations. Observe is architected around a streaming open data lake and O11y Context Graph, using semantic relationships, incremental views, and token indexes to correlate logs, metrics, and traces. Both support OpenTelemetry and AI-assisted operations, but Observe emphasizes data-scale investigation and storage efficiency.
Which is better for small teams?
For a small team, New Relic may be the more straightforward starting point when broad out-of-the-box coverage and integration setup are priorities: it has a free tier, paid plans beginning at $19 per host per month, and users specifically report strengths in setup, real-time monitoring, application performance, and ease of understanding. Observe can also fit small teams because its published Logs plan includes unlimited users and compute, but its strongest value proposition centers on data-lake scale, context-graph correlation, and AI SRE workflows.
Can I migrate from New Relic to Observe?
A migration is feasible in principle because both products support OpenTelemetry-based telemetry collection, allowing teams to standardize instrumentation around an open format rather than proprietary application agents alone. The actual migration work includes inventorying New Relic dashboards, alerts, queries, service definitions, retention requirements, and integrations; configuring Observe ingestion; validating logs, metrics, and traces; and rebuilding operational workflows around Observe's O11y Context Graph and AI SRE experience. The provided information does not state that either vendor offers an automatic New Relic-to-Observe migration utility.
What are the pricing differences?
New Relic provides a free tier and states that paid plans start at $19 per host per month, with further charges based on usage and enabled features. Its highest published tier is custom priced and can include FedRAMP Moderate and HIPAA eligibility with Data Plus, priority ticket routing, a one-hour critical initial-response SLA, and an optional full-consumption model without user licenses. Observe's published Logs plan is $0.49 and includes compute, unlimited users, and 30-day retention; its supplied pricing data also lists rates of $0.00, $0.01, and $0.59 without corresponding tier names or units.