Decision comparison
Elastic Observability vs Observe
Both of these are built for investigation rather than dashboard-watching, and they get there differently. Elastic gives you Elasticsearch: a powerful index, strong full-text log search, and a cluster that can also serve search and security analytics — which you operate. Observe lands telemetry in a data lake and models it into entities and relationships, which makes historical exploration cheap and traversal natural, as a managed service.
Architecture choice. These take different approaches to the same problem. Read the table as a fit question rather than a feature race.
Applies to: For teams that need an observability platform organized around open-source foundations and published plan tiers, we recommend Elastic Observability over Observe.
All 2 are observability platforms.
Quick Comparison
| Decision factor | Elastic Observability | Observe |
|---|---|---|
| What it is | Observability on the Elasticsearch stack, shared with search and security analytics | An observability platform built on a streaming data lake and modelled into entities |
| Storage approach | Elasticsearch indices, with index lifecycle management moving older data to cheaper tiers | A data lake holding raw telemetry, with modelling applied on top rather than at ingest |
| Investigation style | Query the index directly, with strong full-text search across logs | Traverse modelled entities and their relationships, closer to querying a warehouse |
| Operating model | Self-hosted on Docker or Kubernetes, or Elastic Cloud on AWS, GCP and Azure | SaaS, with telemetry landed in the lake rather than a proprietary index |
| Language coverage | APM agents and OpenTelemetry for Java, Python, Node.js, Go and .NET | OpenTelemetry for Java, Python, Node.js, Go and .NET |
| Retention economics | Tiered retention configured through index lifecycle policies | Storage-backed retention, so keeping raw telemetry for long periods is comparatively cheap |
| Beyond observability | Enterprise search and security analytics on the same cluster | Observability only, with modelling as the differentiator |
Elastic Observability
- What it is:
- Observability on the Elasticsearch stack, shared with search and security analytics
- Storage approach:
- Elasticsearch indices, with index lifecycle management moving older data to cheaper tiers
- Investigation style:
- Query the index directly, with strong full-text search across logs
- Operating model:
- Self-hosted on Docker or Kubernetes, or Elastic Cloud on AWS, GCP and Azure
- Language coverage:
- APM agents and OpenTelemetry for Java, Python, Node.js, Go and .NET
- Retention economics:
- Tiered retention configured through index lifecycle policies
- Beyond observability:
- Enterprise search and security analytics on the same cluster
Observe
- What it is:
- An observability platform built on a streaming data lake and modelled into entities
- Storage approach:
- A data lake holding raw telemetry, with modelling applied on top rather than at ingest
- Investigation style:
- Traverse modelled entities and their relationships, closer to querying a warehouse
- Operating model:
- SaaS, with telemetry landed in the lake rather than a proprietary index
- Language coverage:
- OpenTelemetry for Java, Python, Node.js, Go and .NET
- Retention economics:
- Storage-backed retention, so keeping raw telemetry for long periods is comparatively cheap
- Beyond observability:
- Observability only, with modelling as the differentiator
Public signals
Verified factual signals only. Bars appear only for like-for-like metrics with five weekly assessments for every tool; missing evidence stays explicit. These signals do not establish enterprise adoption, product quality, or total cost.
| Metric | Elastic Observability | Observe |
|---|---|---|
| GitHub commits, 90d(Developer adoption) | 423 | Not available |
| GitHub stars(Developer adoption) | 271 | Not available |
| Search interest(Market interest) | 0 | Unavailable |
| Hacker News mentions, 90d(Community interest) | 0 | 0 |
| Stack Overflow questions(Community interest) | 3.7k | Not available |
| PyPI weekly downloads(Developer adoption) | Not available | 1 |
As of September 14, 2026 — updated weekly.
Health & risk evidence
Observed public-source checks for mapped package versions and repositories.
Elastic Observability
Package vulnerabilities
Not available
Repository security score
Not available
Observe
September 14, 2026Package vulnerabilities
PyPI · observe-http-sender@1.3.3
0 vulnerabilities
across 1 package
Repository security score
Not available
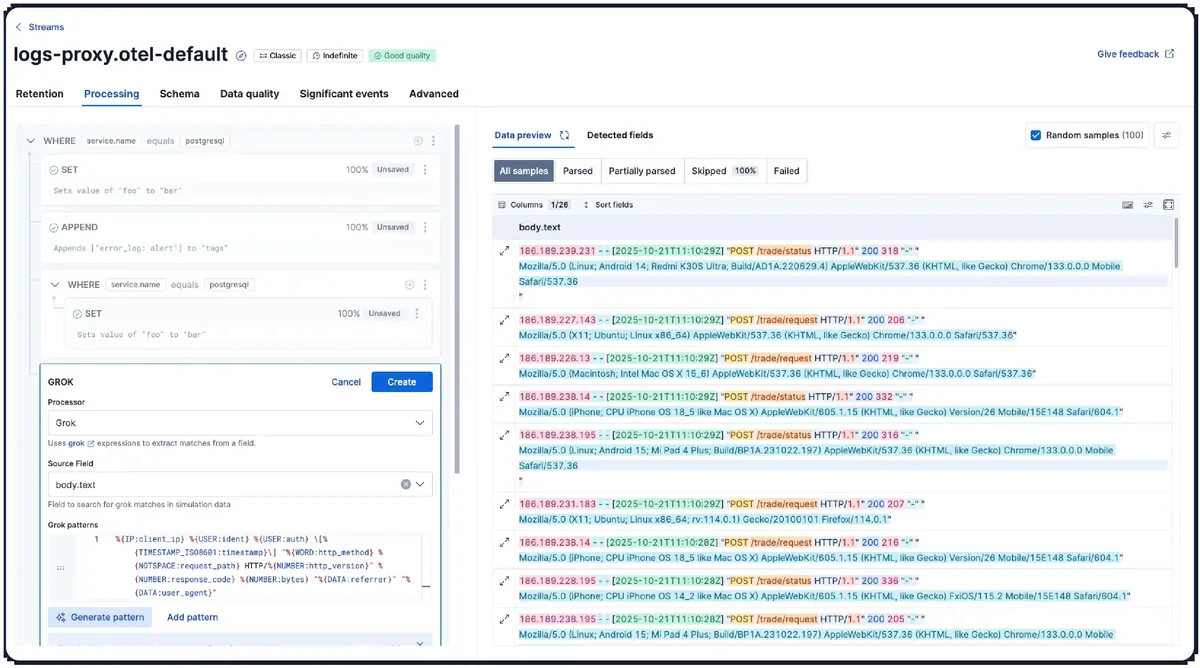
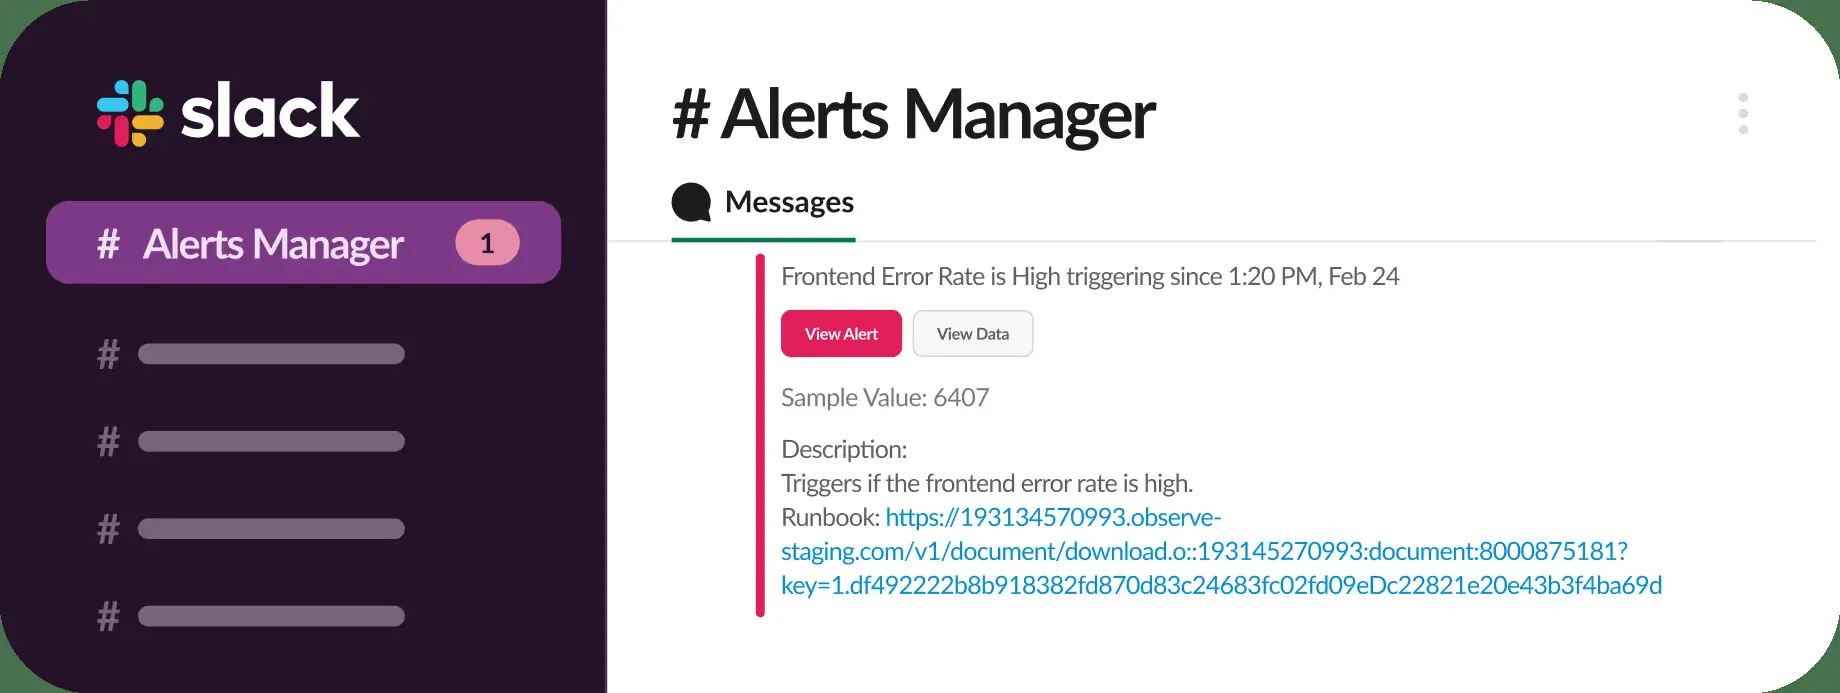
Interface Preview
Elastic Observability
Observe
Feature Comparison
| Feature | Elastic Observability | Observe |
|---|---|---|
| Telemetry | ||
| Distributed tracing | Full support | Full support |
| Metrics and dashboards | Full support | Full support |
| Log management | Full support | Full support |
| Full-text log search | Full support | Partial support |
| Analysis | ||
| Entity relationship modelling | Partial support | Full support |
| Ad-hoc historical exploration | Full support | Full support |
| Long retention of raw telemetry | Partial support | Full support |
| Custom query language | Full support | Full support |
| Operations | ||
| Self-hosted deployment | Full support | Not verified |
| Managed cloud option | Full support | Full support |
| Data residency under your control | Full support | Partial support |
| Lightweight to run | Not verified | Full support |
| Platform | ||
| Shared stack with enterprise search | Full support | Not verified |
| Security analytics on the same data | Full support | Not verified |
| Open-source licence | Partial support | Not verified |
| Alerting | Full support | Full support |
Telemetry
Distributed tracing
Metrics and dashboards
Log management
Full-text log search
Analysis
Entity relationship modelling
Ad-hoc historical exploration
Long retention of raw telemetry
Custom query language
Operations
Self-hosted deployment
Managed cloud option
Data residency under your control
Lightweight to run
Platform
Shared stack with enterprise search
Security analytics on the same data
Open-source licence
Alerting
Which approach fits
Both of these are built for investigation rather than dashboard-watching, and they get there differently. Elastic gives you Elasticsearch: a powerful index, strong full-text log search, and a cluster that can also serve search and security analytics — which you operate. Observe lands telemetry in a data lake and models it into entities and relationships, which makes historical exploration cheap and traversal natural, as a managed service.
When each approach fits
Choose Elastic Observability if:
Choose Elastic Observability when you want to own the stack, need full-text log search, or have search and security workloads that belong on the same cluster. Self-hosting on Docker or Kubernetes keeps data wherever regulation requires, and index lifecycle management gives you tiered retention you configure rather than buy. The cost is running Elasticsearch properly.
Choose Observe if:
Choose Observe when the hard part of your incidents is asking questions nobody anticipated, and you would rather not run the storage. Entity modelling makes relationships traversable rather than reconstructed from tags, and storage-backed retention means the raw telemetry needed for a question about last quarter is still there and still affordable.
These scenarios reflect the available product evidence. Your requirements, existing stack, and team expertise should guide the final decision.
Frequently Asked Questions
What does entity modelling add over a good query language?
A query language lets you ask about the data you have. Entity modelling represents the relationships in it — this container ran on that host, served that customer, called that dependency — so a question like 'what else did this touch' becomes traversal rather than a series of joins you construct by hand. Elasticsearch can answer the same questions with enough query skill; the difference is how much of that skill each incident requires.
Which keeps raw telemetry longer for less?
Observe's storage-backed model is designed for it, so keeping raw detail for months is the normal case rather than a costed exception. Elastic gives you index lifecycle management, which moves older indices to cheaper tiers and is mature and configurable — so long retention is affordable but is something you design rather than get by default.
Can we keep data in our own infrastructure?
With Elastic, yes — it self-hosts on Docker or Kubernetes anywhere, including on-premise. Observe is SaaS, so data goes to the service. If regulation requires telemetry to stay inside your network, that settles the comparison immediately, and no amount of analytical capability changes it.
Which is more work to run?
Elastic, substantially. Shard sizing, index lifecycle management, heap tuning and cluster health are ongoing responsibilities that reward expertise. Observe is managed, so that work does not exist for you. Elastic Cloud narrows the gap if you want the capability without the cluster operations, at which point the comparison becomes about scope and cost.
Do either help with search or security analytics?
Elastic does, and it is one of its strongest arguments: the same cluster and query language serve enterprise search and security analytics, so an organisation needing all three consolidates onto one platform and one skill set. Observe is observability only. If you have those adjacent needs, the consolidation is worth real money and real operational simplicity.
How should we evaluate them against each other?
Take two or three incidents from the last quarter that took longer than they should have, and work out why. If the delay came from data that had aged out, or from reconstructing which services a failing request touched, Observe's retention and entity modelling address exactly that. If it came from nobody being able to search the logs effectively, or from telemetry living in a different system from the business data you needed to correlate it with, Elastic's index and query language address that instead. Both vendors will demo well; your own incident history will not.
Is OpenTelemetry enough to keep this reversible?
It covers the expensive half. Applications emit OTLP and either platform consumes it, so a change of backend is a collector configuration rather than a re-instrumentation project across Java, Python, Node.js, Go and .NET services. What does not transfer is everything built on top — dashboards, saved queries, alert definitions, on-call routing, and in Observe's case the entity model itself. Budget a fortnight for that rebuild rather than assuming a migration is a switch.