Easy Data Transform: product and architecture
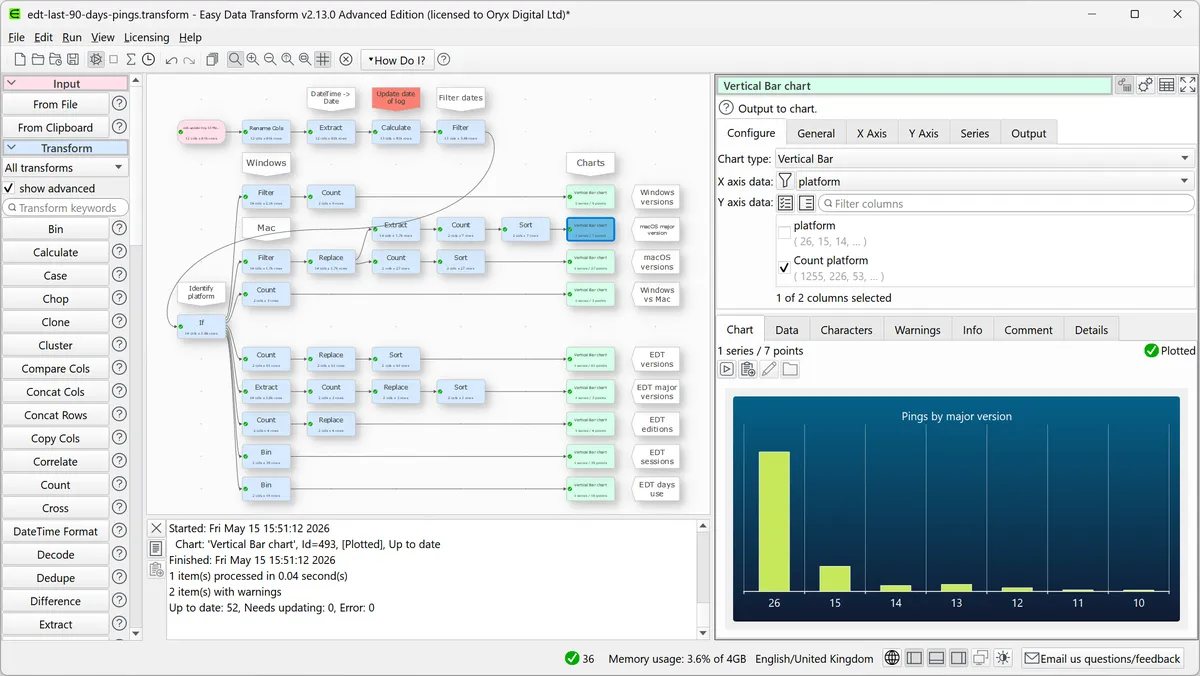
This Easy Data Transform review evaluates the desktop data-preparation app for analysts, operations teams, and other users who need to clean or combine files without maintaining Python, R, or SQL code. We checked the current product, download, documentation, and licensing pages on August 18, 2026, and reviewed a vendor-supplied screenshot of version 2.13 Advanced. Our conclusion is straightforward: Easy Data Transform is a strong fit for repeatable, file-based work on one computer, but it is not a substitute for a cloud data platform, shared semantic layer, or billion-row processing engine.
Overview
Easy Data Transform is a downloadable Windows and macOS application built around a visual graph of inputs, transformations, and outputs. A user can load files, connect steps on a canvas, inspect the result of each step, and save the graph as a reusable transform. Its natural buyer is an analyst or business user who has outgrown manual spreadsheet cleanup but does not need the deployment and governance machinery of an enterprise analytics platform.
The product belongs in business intelligence because its core job is preparing data for analysis and, in the Advanced edition, creating lightweight visualizations. That classification should not be read as full dashboarding: the product works locally and focuses on transforming datasets rather than publishing governed reports to a large audience. Version 2.14.1 was the current download when we checked. The vendor describes in-memory use with millions of rows; buyers planning billion-row workloads should choose a database or distributed engine instead.
Key Features and Architecture
The main workflow is visual and step-based. Users place file inputs on a canvas, add operations, connect them, and inspect intermediate tables before exporting. Documented transformations cover common preparation work such as joins, lookups, filters, sorting, deduplication, pivoting, reshaping, interpolation, missing-value imputation, fuzzy matching, text clustering, regular expressions, statistics, and schema verification. This makes the graph both an executable workflow and a visible record of how an output was produced.
Input support includes Excel XLS and XLSX, CSV, TSV, JSON, XML, fixed-width files, plain text, and vCard. Outputs include Excel, CSV, TSV, JSON, XML, YAML, HTML, Markdown, plain text, and vCard. That breadth is useful when the problem is file conversion or reconciliation. It does not imply a hosted REST API or a managed connector catalog: Easy Data Transform runs on a PC or Mac and processes data in memory.
Saved transforms can be run again, applied across folders in batch, or invoked from the command line. Those options turn a one-off cleanup into a repeatable desktop process without forcing the user to translate a visual flow into code. The Advanced edition adds scatter, line, area, vertical and horizontal bar, pie, and donut charts. These charts suit quick checks and presentation-ready summaries, while Tableau or Power BI remains the better choice for broad dashboard distribution. Local processing is also a meaningful architectural distinction: source data stays on the user's computer unless the user deliberately sends it elsewhere.
Ideal Use Cases
Easy Data Transform is best for a solo analyst who repeatedly receives Excel or CSV exports with inconsistent headers, date formats, duplicates, or layouts. It also fits operations and finance teams that join several local extracts, reshape tables for monthly reporting, or convert JSON and XML into spreadsheet-friendly formats. Batch processing and command-line execution make it useful for a small, scheduled file workflow on a controlled desktop.
Choose it when transparency matters more than code flexibility: seeing the result after each node makes debugging approachable for a non-programmer. The one-time license also suits occasional or steady individual use where a recurring SaaS seat is difficult to justify.
Do not use this tool if the workflow must run as a centrally managed cloud service, serve many simultaneous collaborators, query a warehouse in place, or process billions of rows. It is also a poor fit when transformations need software-engineering controls beyond saved local workflows, or when the main goal is distributing interactive dashboards across an organization.
Strengths & Trade-offs
Pros
- One-time $99 entry price is easy to budget for an individual user.
- Visual intermediate results make complex file cleanup easier to inspect.
- Wide file-format coverage handles practical conversion and reconciliation tasks.
- Batch and command-line modes extend a visual workflow beyond manual clicking.
- Local execution avoids sending source files to a hosted transformation service.
Cons
- In-memory desktop processing is not designed for billion-row data.
- There is no SaaS deployment or shared browser workspace.
- Core omits charting, while Advanced doubles the license price.
- Named-user licenses are non-transferable and do not cover a team.