Decision comparison
Evidence vs Apache Superset
Evidence and Superset are both open source and both read the same warehouse, and they disagree about what a dashboard is. Evidence treats reports as Markdown files containing SQL, built and deployed like a website, with every change reviewed in a pull request. Superset is a browser-based platform where analysts assemble dashboards from datasets without writing files.
Direct comparison. These are reviewed substitutes bought for the same job, so the differences below are the ones that decide between them.
All 2 are BI platforms.
Quick Comparison
| Decision factor | Evidence | Apache Superset |
|---|---|---|
| What it is | A code-based BI framework where reports are Markdown files containing SQL and charts, built and deployed like a website | An Apache-governed BI platform where dashboards are built in a browser over warehouse connections |
| How a report is made | Written in a file, reviewed in a pull request, deployed by continuous integration | Assembled in the browser by choosing a dataset, a chart type and filters |
| Audience | Analytics engineers comfortable with Git and SQL | Analysts and business users who want a visual builder |
| Chart range | A focused set aimed at narrative reporting | A wide library covering most visualisation needs |
| Governance | Version control: every change has a diff, an author and a history | Role-based access control and dataset permissions in the application |
| Best fit | Data teams who want analytics reviewed like code | Organisations wanting self-service dashboards for a wide audience |
| Connectivity | Queries Snowflake, BigQuery, Redshift, Databricks and Postgres over standard drivers | Queries Snowflake, BigQuery, Redshift, Databricks and Postgres over standard drivers |
Evidence
- What it is:
- A code-based BI framework where reports are Markdown files containing SQL and charts, built and deployed like a website
- How a report is made:
- Written in a file, reviewed in a pull request, deployed by continuous integration
- Audience:
- Analytics engineers comfortable with Git and SQL
- Chart range:
- A focused set aimed at narrative reporting
- Governance:
- Version control: every change has a diff, an author and a history
- Best fit:
- Data teams who want analytics reviewed like code
- Connectivity:
- Queries Snowflake, BigQuery, Redshift, Databricks and Postgres over standard drivers
Apache Superset
- What it is:
- An Apache-governed BI platform where dashboards are built in a browser over warehouse connections
- How a report is made:
- Assembled in the browser by choosing a dataset, a chart type and filters
- Audience:
- Analysts and business users who want a visual builder
- Chart range:
- A wide library covering most visualisation needs
- Governance:
- Role-based access control and dataset permissions in the application
- Best fit:
- Organisations wanting self-service dashboards for a wide audience
- Connectivity:
- Queries Snowflake, BigQuery, Redshift, Databricks and Postgres over standard drivers
Public signals
Verified factual signals only. Bars appear only for like-for-like metrics with five weekly assessments for every tool; missing evidence stays explicit. These signals do not establish enterprise adoption, product quality, or total cost.
| Metric | Evidence | Apache Superset |
|---|---|---|
| GitHub commits, 90d(Product adoption) | 40 | 2.3k |
| GitHub stars(Product adoption) | 6,500+ | 74,000+ |
| Search interest(Market interest) | 0 | 0 |
| npm weekly downloads(Product adoption) | 18.9k | Not available |
| Product Hunt comments(Community interest) | 28 | 0 |
| Product Hunt rating(Community interest) | 4.8/5 | Unavailable |
| Product Hunt reviews(Community interest) | 4 | 0 |
| Product Hunt votes(Community interest) | 113 | 69 |
| Docker Hub pulls(Product adoption) | Not available | 605.5M |
| Hacker News mentions, 90d(Community interest) | Not available | 0 |
| npm weekly downloads(Developer adoption) | Not available | 13.8k |
| PyPI weekly downloads(Product adoption) | Not available | 87.1k |
| Stack Overflow questions(Community interest) | Not available | 1.3k |
As of September 21, 2026 — updated weekly.
Health & risk evidence
Observed public-source checks for mapped package versions and repositories.
Evidence
September 21, 2026Package vulnerabilities
npm · @evidence-dev/evidence@40.1.8
0 vulnerabilities
across 1 package
Repository security score
Not available
Apache Superset
September 21, 2026Package vulnerabilities
npm · @superset-ui/core@0.20.4 · PyPI · apache-superset@6.1.0
0 vulnerabilities
across 2 packages
Repository security score
github.com/apache/superset
5.4/10
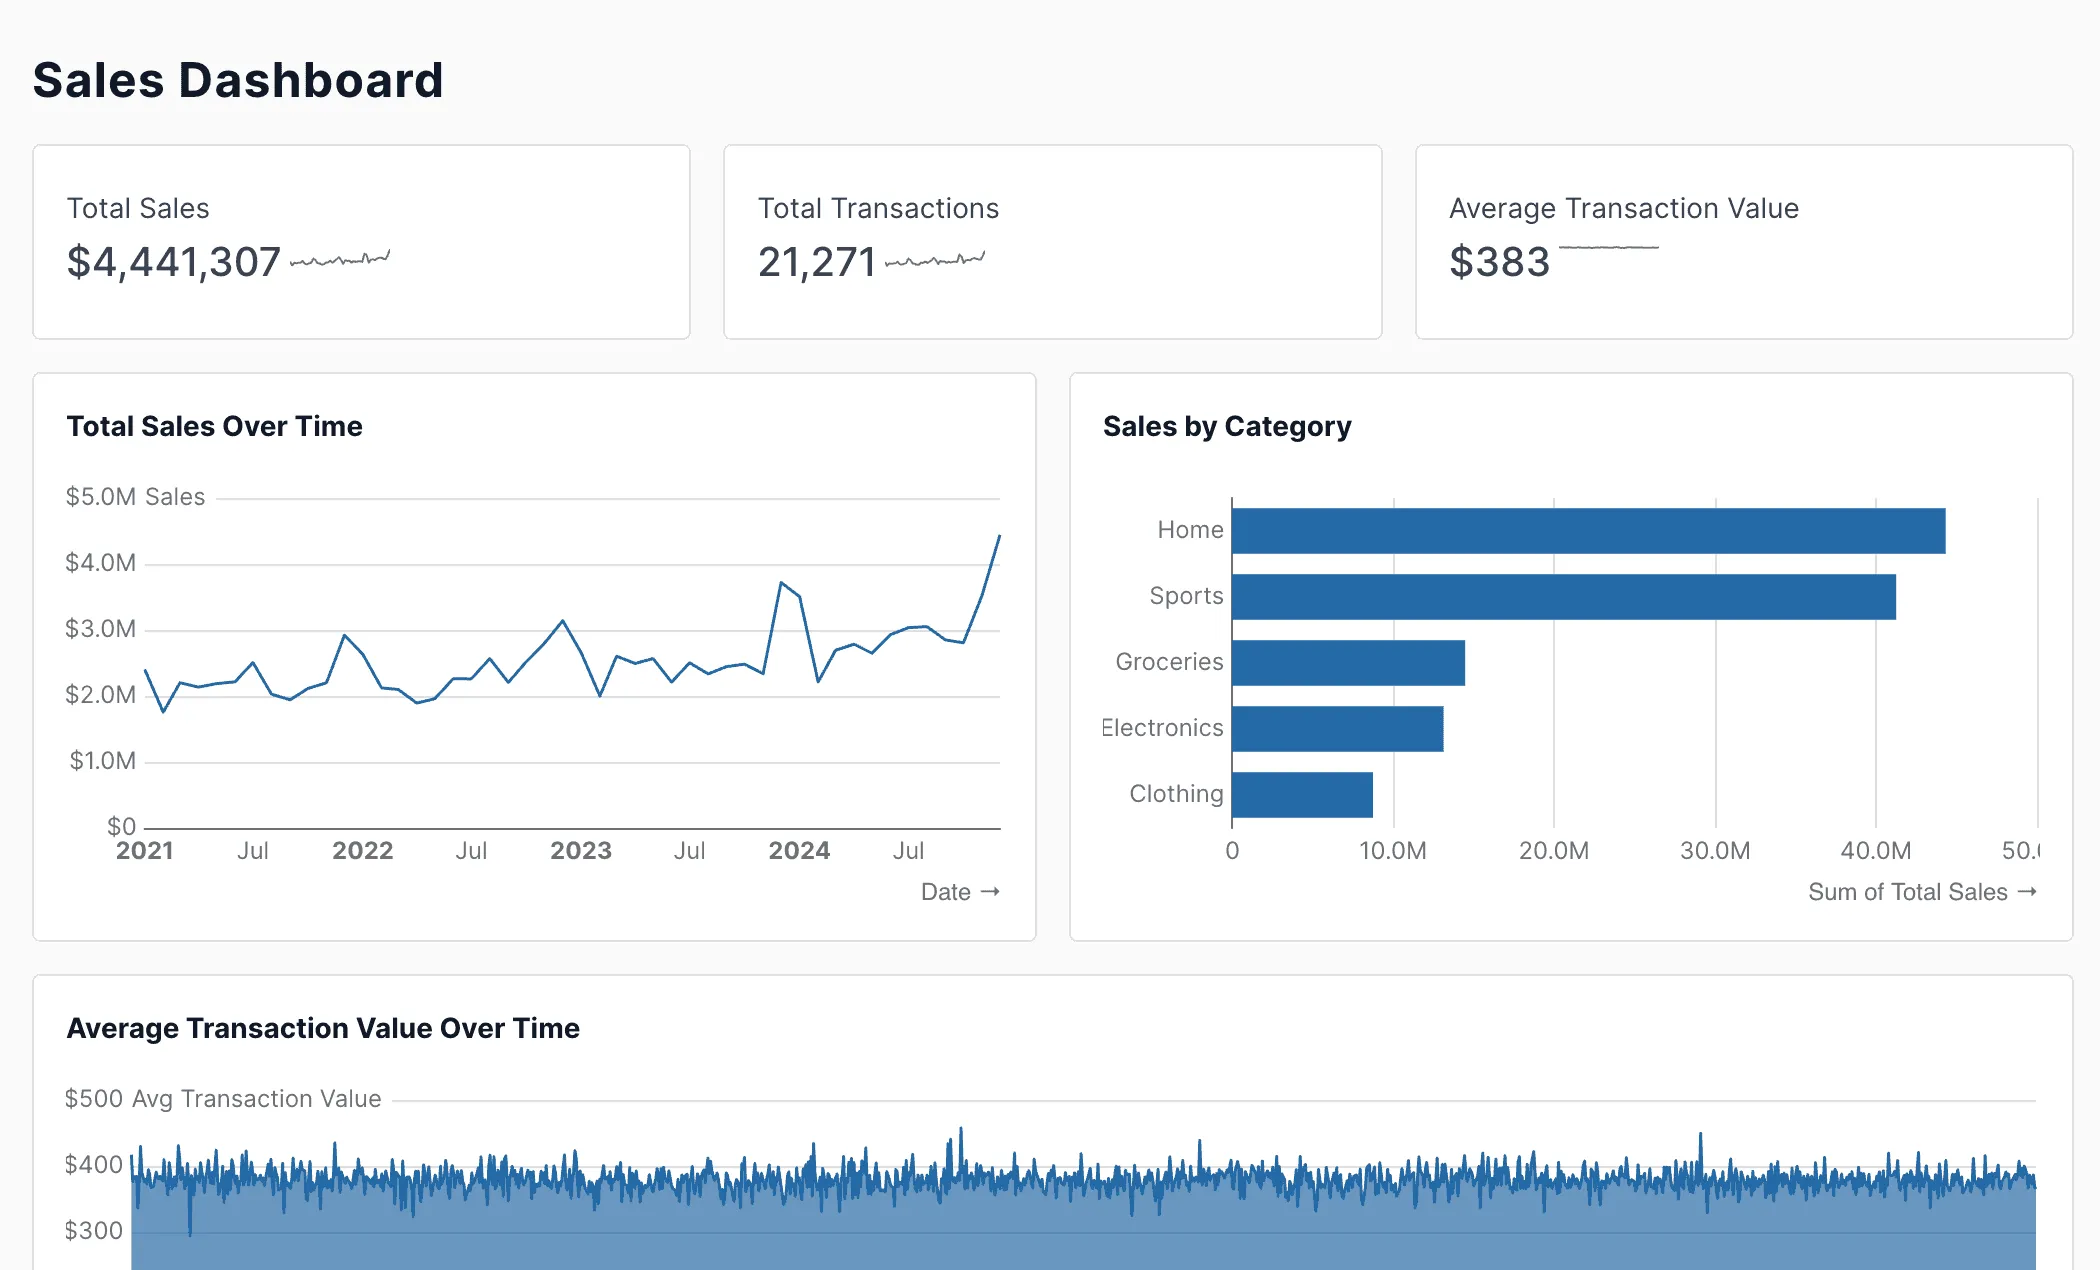
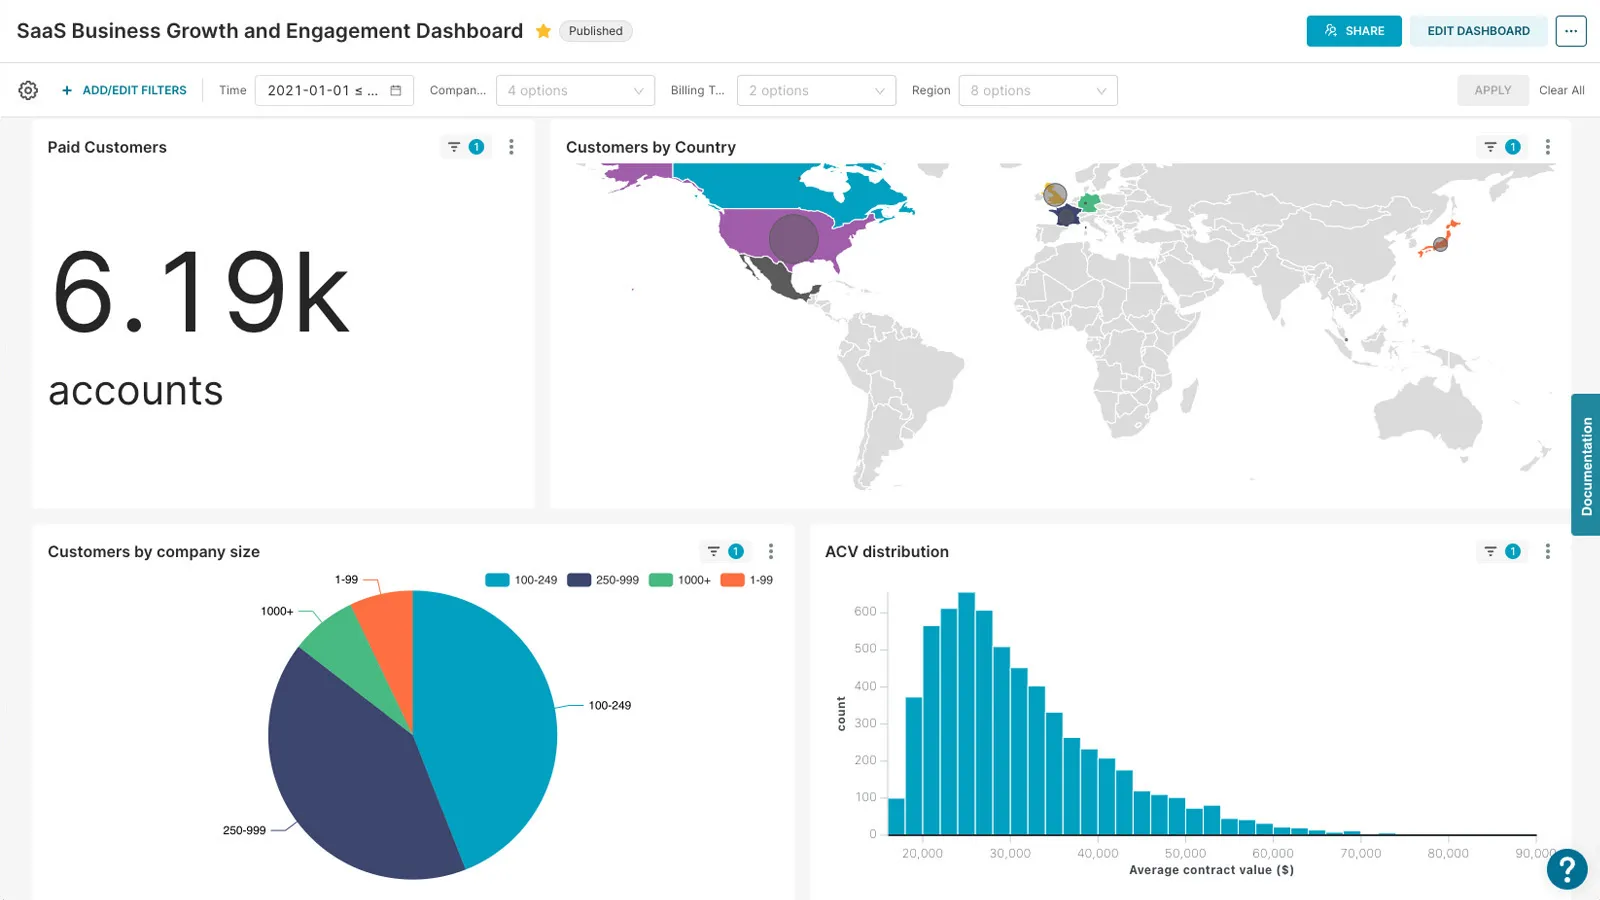
Interface Preview
Evidence
Apache Superset
Feature Comparison
| Feature | Evidence | Apache Superset |
|---|---|---|
| Authoring | ||
| Visual dashboard builder | Not verified | Full support |
| Reports as version-controlled files | Full support | Not verified |
| Pull request review of changes | Full support | Not verified |
| Wide chart library | Partial support | Full support |
| Delivery | ||
| Static site output | Full support | Not verified |
| Interactive filtering | Partial support | Full support |
| Embedding in your own application | Full support | Full support |
| Row-level security | Partial support | Full support |
| Adoption | ||
| Usable without engineering help | Not verified | Full support |
| Continuous integration friendly | Full support | Partial support |
| Large community | Partial support | Full support |
| Runs on your own infrastructure | Full support | Full support |
| Platform | ||
| Warehouse connectivity | Full support | Full support |
| Self-hosted deployment | Full support | Full support |
| Open source | Full support | Full support |
| Scheduled delivery | Full support | Full support |
Authoring
Visual dashboard builder
Reports as version-controlled files
Pull request review of changes
Wide chart library
Delivery
Static site output
Interactive filtering
Embedding in your own application
Row-level security
Adoption
Usable without engineering help
Continuous integration friendly
Large community
Runs on your own infrastructure
Platform
Warehouse connectivity
Self-hosted deployment
Open source
Scheduled delivery
Which to choose
Evidence and Superset are both open source and both read the same warehouse, and they disagree about what a dashboard is. Evidence treats reports as Markdown files containing SQL, built and deployed like a website, with every change reviewed in a pull request. Superset is a browser-based platform where analysts assemble dashboards from datasets without writing files.
Best-fit scenarios
Choose Evidence if:
Choose Evidence when the people maintaining reports already work in Git and dbt. Reports as files mean every change has a diff, an author and a history, continuous integration can test them before they ship, and the logic does not walk out when its author does.
Choose Apache Superset if:
Choose Apache Superset when the audience building dashboards is wider than the data team. A browser-based builder with a large chart library, dataset permissions and row-level security lets analysts across departments serve themselves without a repository or a review process.
These scenarios reflect the available product evidence. Your requirements, existing stack, and team expertise should guide the final decision.
Frequently Asked Questions
Who edits a dashboard in eighteen months?
That question decides this comparison more reliably than features. If it is a data team already working in pull requests, code-based reporting removes drift and makes changes reviewable. If it is business analysts across several departments, a workflow requiring Git will not be adopted and the dashboards will quietly move back into spreadsheets.
What do you lose without a visual builder?
Reach. A visual builder lets somebody who knows the business but not the tooling answer their own question, which is the main reason BI platforms exist. Code-based analytics trade that for reviewability and consistency, which is a good trade for a data team and a bad one for a wide audience. Be honest about which you are serving.
Can they coexist?
Reasonably well, and some teams run both: a browser platform for self-service exploration, and code-based reports for the numbers that must be right and reviewed — board reporting, regulatory returns, anything where a silent change is unacceptable. The cost is two systems to maintain, which is only worth it when the governed set is genuinely distinct.
What does each one need to run?
Evidence needs a build step and somewhere to serve static files: a CI job runs the queries, renders the Markdown reports and publishes the output, which is the same shape as deploying any static site, plus credentials to reach the warehouse at build time. Superset needs a running service — a metadata database, a cache, workers for asynchronous queries, and somebody to upgrade it — which is ordinary web-application operations and is continuous rather than per-deploy. One is a pipeline you run; the other is a platform you keep alive.
What happens to the cost as more people use it?
Neither charges per seat, because neither charges at all — both are open source, which removes the usual growth cliff entirely. What grows instead is different in each. Evidence's static builds query the warehouse once per build regardless of how many people read the result, so a wider audience is close to free and a faster refresh cadence is what costs. Superset queries on behalf of users, so more viewers means more warehouse compute, moderated by caching. Model the warehouse bill, because that is the only line that actually scales.
How should we evaluate them?
Rebuild one dashboard people already rely on, and answer one question nobody has a dashboard for. The first tests modelling, refresh and permissions against something you already understand, so differences are obvious. The second tests whether a person who is not on the data team can actually get an answer, which is what self-service means and what demos never show.