300+ Tools CoveredSource Data Updated Weeklydates

Tool intelligence profile

Evidence

Evidence is an open source, code-based alternative to drag-and-drop BI tools. Build polished data products with just SQL and markdown.

Visit Site →
Type
BI Platform
Deployment
Cloud or self-hosted
Last updatedSeptember 21, 2026

Editor's Take

We recommend Evidence for data teams comfortable with SQL and markdown that want to build polished, version-controlled data products instead of relying on drag-and-drop BI tools such as Tableau. Its freemium, open-source model makes it a strong fit for small teams validating embedded analytics or internal reporting needs, but available evidence does not establish enterprise-scale adoption or total cost at larger deployments.

— Egor Burlakov, Editor

Evaluate Evidence

Comparisons

Evidence: product and architecture

Evidence is a strong choice for teams that want business intelligence to live in the same disciplined workflow as analytics code, rather than in a drag-and-drop dashboard editor. This Evidence review finds that it is best for data teams comfortable with SQL, markdown, version control, and review-based development; teams that need non-technical users to build ad hoc dashboards independently should look elsewhere. Its core proposition is clear: build polished, interactive data products using SQL and markdown, then publish them internally, share them with customers, or embed them in an application.

Overview

Evidence positions itself as an open-source, code-based alternative to conventional drag-and-drop BI tools. Instead of configuring charts through a visual canvas, analysts write SQL queries and markdown documents, then combine them with interactive visualization components. That model makes the tool particularly relevant for analytics engineers and data engineers who already treat transformations, metrics definitions, and documentation as versioned assets.

The decision is not subtle: Evidence favors repeatability and engineering control over visual self-service. We recommend Evidence for teams that want reports and dashboards to go through pull requests, testing, and version control alongside the rest of their data work. The trade-off is that a code-first interface creates a higher entry bar for business users who do not write SQL or work in repositories.

Evidence also extends beyond internal reporting. Its product description includes dashboards, articles, data apps, AI chat, customer analytics, embedded analytics, and business reviews. That breadth matters because the same SQL-and-markdown approach can support a polished internal executive report or a customer-facing embedded experience, but it also means a team must establish its own conventions for report structure, permissions, deployment, and ownership.

Public repository activity supports the view that Evidence is an active open-source project, though it is not proof of enterprise adoption. The GitHub repository has 6,847 stars, uses JavaScript as its primary language, carries an MIT license, and was last pushed on February 18, 2026. Its latest listed release is @evidence-dev/evidence@40.1.8, dated February 6, 2026, which is a useful concrete signal for teams evaluating project maintenance.

Key Features and Architecture

Evidence’s architecture centers on authored files rather than a dashboard-building canvas. Authors write readable SQL to retrieve data and markdown to compose narrative, headings, and presentation, then add interactive visualization components to turn the result into a responsive data product. This is a practical fit for teams that already use software-development practices for dbt projects, analytics repositories, or metric documentation.

Key capabilities include:

  • SQL and markdown authoring: Evidence lets teams build reports directly from SQL and markdown. This creates a durable audit trail for query logic and explanatory context, but it requires authors to be competent with both data querying and document-oriented composition.
  • Publication-quality visualization design: The product emphasizes visualizations designed for all device sizes. That supports polished stakeholder and customer-facing outputs, although the supplied product data does not establish how much chart-level configuration can be done without editing authored source.
  • Responsive interactive data products: Teams can combine data-visualization components into dashboards and data apps, then publish, share, or embed the result. This is more flexible than treating every output as a static report, but it broadens the engineering responsibility around release management.
  • Real-time syntax validation: Evidence automatically validates SQL, markdown, and component syntax while authors work. Catching errors before a report reaches review is valuable, especially when one document contains query logic, prose, and visualization syntax.
  • Intelligent autocomplete: The development environment provides suggestions for components, visualization options, SQL queries, and related inputs. This reduces friction in a text-based workflow, though it does not remove the need to understand the underlying data model.
  • Version control and testing: Evidence explicitly supports tracking changes and testing reports with the same tools software engineers use. This is one of its strongest differentiators for regulated, high-stakes, or frequently changed reporting, because a dashboard change can be reviewed as a change to source.
  • AI-enhanced development: Its AI agent can look up documentation, check a schema, debug errors, and write Evidence markdown. That can accelerate experienced authors, but teams should still review generated SQL and narrative output before publishing.
  • Performance-oriented query layer: Evidence describes sub-second interactions on millions of records and queries of billions of rows in milliseconds through columnar storage and vectorized execution. It also describes multi-level caching, automatic query optimization, and memory management; these are meaningful technical claims, but the supplied data provides no benchmark methodology or workload definition.

The project’s repository topics include analytics, business intelligence, dashboards, data engineering, data science, data visualization, dbt, and DuckDB. Those labels reinforce that Evidence belongs in an engineering-led analytics stack rather than a purely business-led reporting environment. The repository description summarizes the architecture accurately: business intelligence as code for fast, interactive visualizations in SQL and markdown.

Ideal Use Cases

Evidence is most effective when the report itself should be treated as a maintainable software artifact. A data platform team of five to fifteen people supporting a growing analytics organization can use it to put recurring operating reports, KPI explanations, and dashboard changes through the same repository workflow as transformation code. In that setting, SQL and markdown are not obstacles; they are the shared language that makes logic inspectable and changes reviewable.

A second strong scenario is customer-facing or embedded analytics. A B2B software team that needs to publish responsive dashboards or data applications can use Evidence’s interactive components and embedding-oriented product positioning to create a controlled presentation layer. The trade-off is that the team is building and maintaining a data product, not simply handing a business user a dashboard editor, so ownership should sit with an engineering-capable analytics function.

A third use case is analytical reporting where narrative matters as much as a chart. For example, a data leader can standardize monthly business reviews as markdown-based documents that include SQL-backed visualizations, written interpretation, and a versioned history of edits. This is especially useful when stakeholders need a consistent explanation of what changed, rather than a collection of unannotated dashboard tiles.

Evidence is also appropriate for data teams that want automated reports without separating the query definition from the final presentation. Its real-time syntax validation and autocomplete help authors work faster, while version control and testing make it easier to govern changes across multiple reports. We recommend it for organizations where analytics engineers already own the semantic and presentation layer, or where analysts are expected to work comfortably in code.

Do not use Evidence if your primary requirement is broad, no-code dashboard self-service for a large population of business users. The provided product information establishes SQL and markdown as the authoring model, so forcing non-technical users into that workflow will turn a governance advantage into a bottleneck. Avoid it as the sole BI interface if your operating model depends on casual users assembling their own reports without repository access, code review, or SQL fluency.

Strengths & Trade-offs

In our evaluation, Evidence’s strengths are concrete and closely tied to its code-first design:

  • Source-controlled reporting is built into the product model. SQL, markdown, report changes, and tests can use the same version-control practices as engineering work, making logic reviewable rather than hidden inside a visual editor.
  • It supports narrative-driven analytics. Markdown lets a team pair explanations with interactive visualizations, which is better suited to recurring business reviews and decision documents than dashboards that provide no written context.
  • The development experience includes guardrails. Real-time validation covers SQL, markdown, and component syntax, while autocomplete covers components, visualization options, and SQL queries; this directly reduces authoring mistakes in a multi-language document.
  • Performance claims target substantial analytical workloads. Evidence states sub-second interaction on millions of records and milliseconds-scale queries across billions of rows using columnar storage and vectorized execution.
  • The project is inspectable and actively maintained. It is MIT-licensed, has 6,847 GitHub stars, and lists a February 2026 release, which are public signals that teams can examine when assessing ecosystem health.
  • It is designed for more than internal dashboards. The documented ability to publish internally, share with customers, or embed outputs makes Evidence relevant to product analytics and customer analytics use cases.

Its limitations are equally important:

  • Evidence is weak for no-code self-service. Its central workflow requires SQL and markdown, so non-technical users cannot be assumed to build or modify reports comfortably without support from a data team.
  • The flat price is high for a small team. At $2,500 per month for unlimited users, Evidence is priced for an organisation rather than a handful of analysts, and Enterprise carries no published figure at all.
  • The supplied performance claims lack benchmark detail. “Millions of records,” “billions of rows,” and “milliseconds” are useful directionally, but the available material does not define hardware, datasets, concurrency, or query shapes.
  • AI assistance still requires expert review. An agent that checks schemas, debugs errors, and writes markdown can speed drafting, but it does not eliminate responsibility for validating SQL logic, business definitions, and published conclusions.
Evidence pricing

Starting at
From $2,500/mo
Pricing model
Paid plans
Free access
Free trial

View full Evidence pricing intelligence →

Alternatives to Evidence

The reviewed substitutes for Evidence among the BI platforms, and what would make each one the better answer.

Direct alternatives

Reviewed substitutes: products bought for the same job, where a team picks one.

Metabase
Two products of the same kind on one reviewed shortlist, answering the same purchase. open-source BI round-ups compare these projects directly for the self-hosting decision, and a team adopts one, so the comparison is a substitution.Applies to: Choosing between these two for the open source bi decision.
Lightdash
Two products of the same kind on one reviewed shortlist, answering the same purchase. open-source BI round-ups compare these projects directly for the self-hosting decision, and a team adopts one, so the comparison is a substitution.Applies to: Choosing between these two for the open source bi decision.
Redash
Two products of the same kind on one reviewed shortlist, answering the same purchase. open-source BI round-ups compare these projects directly for the self-hosting decision, and a team adopts one, so the comparison is a substitution.Applies to: Choosing between these two for the open source bi decision.
Apache Superset
Two products of the same kind on one reviewed shortlist, answering the same purchase. open-source BI round-ups compare these projects directly for the self-hosting decision, and a team adopts one, so the comparison is a substitution.Applies to: Choosing between these two for the open source bi decision.
Looker
Both are BI platforms answering the same purchase: dashboards, exploration and governed metrics over a warehouse. Independent 2026 buyer's guides and vendor head-to-heads place them on one shortlist, and teams license one, so the comparison is a substitution rather than an architecture question.Applies to: Choosing the BI platform a team will license for dashboards and self-service exploration.

Other approaches

A different approach to the same problem. Each substitutes only for the workload named beside it.

Spotfire
Evidence replaces Spotfire for code-authored SQL and markdown reporting workloads. **Evidence** is an open-source, code-based BI platform for building polished data products with SQL and markdown instead of drag-and-drop dashboards.
See detailed alternatives analysis

If you are evaluating Evidence alternatives, you are likely looking for a business intelligence tool that fits your team's workflow, technical comfort level, and budget. Evidence takes a distinctive code-based approach to BI -- using SQL and markdown to build reports and dashboards -- but that paradigm is not the right fit for every organization. Below, we break down the leading alternatives across architecture, pricing, and use-case fit to help you make an informed decision.

Top Alternatives Overview

Evidence competes in the Business Intelligence (BI) category alongside both open-source and commercial platforms. Here are the most notable alternatives worth evaluating:

Metabase is an open-source BI tool focused on making data exploration accessible to non-technical users. It offers a visual query builder that lets team members ask questions about data without writing SQL, while still providing a full SQL editor for power users. Metabase has a sizable open-source community with over 48,000 GitHub stars and connects to over 20 data sources. It is built in Clojure and provides features like drill-through navigation, scheduled reports, Metabot AI for natural-language queries, and embedded analytics via a React SDK. Metabase holds an 8.4/10 user rating across 66 reviews.

Lightdash is an open-source, AI-native BI platform built specifically for dbt users. It provides a semantic layer that connects directly to dbt projects, enabling teams to define metrics once and reuse them consistently. Lightdash emphasizes a "BI-as-code" workflow with version control, preview environments, and CI/CD integration. It has accumulated over 5,700 GitHub stars and is built in TypeScript. Lightdash supports agentic BI workflows where AI agents can build dashboards, answer questions via Slack, and generate reports through a governed semantic layer.

KNIME takes a visual, node-based workflow approach to data analytics. Rather than writing code or using drag-and-drop dashboards, users connect nodes together to create data processing pipelines. KNIME Analytics Platform is free for personal use and supports over 300 data connectors. It spans data blending, machine learning, and deployment -- making it a broader data science platform rather than a pure BI tool. KNIME is built in Java with over 770 GitHub stars.

Redash is a lightweight, open-source data visualization tool that focuses on connecting to data sources, writing SQL queries, and building shareable dashboards. Originally an independent project, Redash was acquired by Databricks in 2020. It is self-hosted under a BSD-2-Clause license, has over 28,500 GitHub stars, and supports a wide range of databases including PostgreSQL, MySQL, BigQuery, and MongoDB. Redash holds an 8.1/10 user rating across 17 reviews.

Sigma Computing is a cloud-native BI platform that combines the familiar interface of a spreadsheet with the scale of a data warehouse. It enables business users to explore data without SQL knowledge, while maintaining governance and security controls. Sigma holds an 8.2/10 user rating across 297 reviews and offers a free tier for up to 5 users.

Power BI is Microsoft's BI and data visualization platform, tightly integrated with Microsoft 365 and Azure. It offers a free tier for individual users and is a natural fit for organizations already invested in the Microsoft ecosystem. Power BI Pro is available at $9/user/month.

Architecture and Approach Comparison

The fundamental architectural distinction among these tools lies in how users interact with data and build reports.

Code-based vs. visual builders: Evidence and Lightdash both embrace a code-first philosophy. Evidence uses SQL and markdown files, versioned in Git, to produce publication-quality reports and dashboards. It is built on Svelte and JavaScript, released under the MIT license, and leverages DuckDB for client-side query execution with WebAssembly. Lightdash similarly operates as code but is deeply tied to dbt, using dbt models and metrics as its semantic foundation. Both tools appeal to data teams comfortable with developer workflows -- version control, pull requests, and CI/CD pipelines.

In contrast, Metabase, Sigma Computing, and Power BI prioritize visual, no-code or low-code interfaces. Metabase's visual query builder lets non-technical users explore data through point-and-click interactions, with an escape hatch into SQL when needed. Sigma Computing reimagines the spreadsheet as an analytics interface, letting business users perform complex analyses using familiar spreadsheet paradigms but against live warehouse data. Power BI provides a desktop application and web service with drag-and-drop report building.

KNIME occupies a unique position with its node-based visual workflow editor. Users build data pipelines by connecting nodes that represent discrete operations -- data reading, transformation, modeling, and visualization. This makes it particularly strong for data science workflows that extend beyond traditional BI dashboards into machine learning and advanced analytics.

Query engine and performance: Evidence Query Engine, providing columnar storage and vectorized execution for sub-second queries across large datasets. It also features multi-level caching with automatic query optimization and memory management. Metabase, Redash, and Lightdash function as visualization layers that sit on top of your existing database -- they send queries to your data warehouse and render the results. Metabase does offer result and model caching to keep dashboards responsive. Sigma Computing queries your cloud data warehouse directly without data extraction.

Deployment model: Evidence, Metabase, Lightdash, Redash, and KNIME all offer self-hosted open-source editions, giving teams full control over their infrastructure. Evidence, Metabase, Lightdash, and Sigma Computing also provide managed cloud offerings. Power BI is primarily a SaaS product with deep Azure integration. Amazon QuickSight is fully managed within the AWS ecosystem.

Security and governance: Evidence provides row-level security through built-in RLS policies and is SOC 2 Type II certified. It also supports SSO, directory sync via SCIM, SIEM logging, and customer-managed encryption keys. Metabase offers row-level, column-level, and collection-level permissions, along with SSO integration (SAML, LDAP, JWT, Google). Lightdash provides SOC 2 compliance with HIPAA and BAA support, plus custom roles and SCIM 2.0 for enterprise deployments.

Pricing Comparison

Pricing structures vary significantly across these tools, reflecting different go-to-market strategies.

Evidence charges one flat price rather than per seat: Team is $2,500 per month for unlimited users, billed monthly, and Enterprise is quote-only. A 30-day trial is offered, and Evidence also has a free open-source edition that can be self-hosted.

Metabase offers a fully free open-source self-hosted edition. Its cloud plans include a Starter tier at $100/month, a Pro tier at $575/month, and an Enterprise tier priced custom from $20,000 per year (contact sales for details). The Starter and Pro tiers do not charge per seat.

Lightdash provides a free self-hosted open-source edition. Its Cloud Pro plan is $3,000/month with no per-seat pricing and unlimited users. Enterprise pricing is available by contacting sales. Embedding is available as an add-on, with pay-as-you-go pricing at $0.05 per load after the first 1,000 free loads, or a predictable plan at $790/month for sizable volumes.

KNIME Analytics Platform is free for personal use. Paid options for the Business Hub are listed at $19/month, $49/month, and $99/month.

Redash is entirely free and open source under a BSD-2-Clause license for self-hosted deployments. There is no commercial cloud offering since the Databricks acquisition.

Sigma Computing offers a free tier for up to 5 users, with Pro plans starting at $25/user/month. Enterprise pricing requires contacting sales.

Power BI starts with a free tier for one user, with Pro at $9/user/month and Premium at $39/user/month.

Amazon QuickSight offers a no published free tier. Its usage-based pricing includes Standard plans starting at around $3-$24/user/month depending on configuration, with enterprise custom pricing. QuickSight also offers capacity-based pricing with various volume tiers.

When to Consider Switching

Choosing to move away from Evidence -- or choosing it over alternatives -- depends on your team's composition, technical maturity, and specific requirements.

Consider switching from Evidence if your team includes many non-technical stakeholders who need to explore data independently. Evidence's code-based workflow requires comfort with SQL, markdown, and Git. If your business users need self-service analytics with a visual query builder, Metabase or Sigma Computing may be more appropriate. Metabase's point-and-click interface and natural-language Metabot AI feature specifically target this use case.

Consider switching if you need a mature embedded analytics solution for your SaaS product. While Evidence supports embedding, Metabase offers a dedicated React SDK and extensive white-labeling capabilities designed for in-product analytics at scale, with options from iframe embedding to full SDK customization.

Consider switching if your organization is heavily invested in dbt and wants your BI layer tightly coupled with your data transformation layer. Lightdash is built specifically for dbt users, with native integration that keeps your models and metrics in sync through a governed semantic layer. Evidence connects to dbt-powered warehouses but does not share the same deep dbt-native semantic layer design.

Consider switching if your needs extend beyond BI into data science workflows -- model training, advanced machine learning, or complex data transformation pipelines. KNIME's visual workflow platform with its node-based approach and Alteryx's data automation capabilities serve these broader analytical needs better than a BI-focused tool.

Stick with Evidence if your team values a developer-centric workflow, wants reports and dashboards version-controlled in Git, and appreciates the simplicity of SQL plus markdown. Evidence's approach eliminates the complexity of drag-and-drop builders in favor of clean, reproducible, code-driven analytics. Its built-in query engine and managed infrastructure also appeal to teams that want high performance without managing separate data infrastructure. The AI-enhanced development experience, with Build your analytics agent with custom context and skills., further accelerates the code-first workflow.

Migration Considerations

Moving between BI tools involves more than just switching software. Here are the key factors to evaluate before migrating.

Content portability: Reports and dashboards built in Evidence are SQL and markdown files stored in Git, which makes them relatively portable -- the SQL queries can be reused in any tool that supports SQL. However, Evidence-specific markdown components, Svelte customizations, and visualization syntax will need to be recreated in the target tool's format. Moving from a visual tool to Evidence similarly requires translating point-and-click configurations into SQL and markdown.

Data source connections: Most modern BI tools support the same major data warehouses (Snowflake, BigQuery, PostgreSQL, ClickHouse, etc.), so database connectivity is rarely a blocker. Verify that your target tool supports all your specific data sources and any advanced features you rely on, such as row-level security, scheduled data syncs, or live query capabilities.

User training and adoption: The biggest migration cost is often human. Moving from a code-based tool like Evidence to a visual tool (or vice versa) requires your team to learn entirely new workflows. Budget time for training and expect a temporary productivity dip during the transition. If migrating to Lightdash from Evidence, the learning curve is gentler since both tools share a code-oriented philosophy and Git-based workflows.

Permissions and governance: Evaluate how each tool handles data access control. Evidence provides row-level security through built-in RLS policies and supports SOC 2 Type II compliance. Metabase offers row-level, column-level, and collection-level permissions with SSO integration. Sigma Computing and Power BI provide enterprise-grade governance features. Lightdash supports SOC 2 compliance with HIPAA support and custom roles. Ensure your target tool can replicate your existing access control requirements.

Cost of transition: Factor in not just the subscription cost difference but also engineering time for migration, potential downtime in reporting, and the cost of maintaining parallel systems during the transition period. Organizations using Evidence's managed cloud offering should also consider data residency requirements (Evidence supports multi-region deployment) and compliance needs when switching providers. Running both systems in parallel during the transition period helps prevent reporting gaps for stakeholders.

Public signals

About these signals

Verified factual signals from public sources. They indicate observable activity or interest, not total adoption, product quality, or cost.

40 GitHub commits 90d7.0k GitHub stars0 vulnerabilities across 1 package

See all signals from 5 sources
Source
Signals
Last updated
GitHub
Commits 90d:40↑7Stars:7.0k↑15
September 21, 2026
npm
Weekly downloads:18.9k↓436
September 21, 2026
Google Trends
Search interest:Top 67%overallTop 67%in Business Intelligence
September 21, 2026
Product Hunt
Comments:28Rating:4.8/5Reviews:4Votes:113
September 21, 2026
OSV
Package vulnerabilities:0 vulnerabilitiesacross 1 package

npm · @evidence-dev/evidence@40.1.8

September 21, 2026
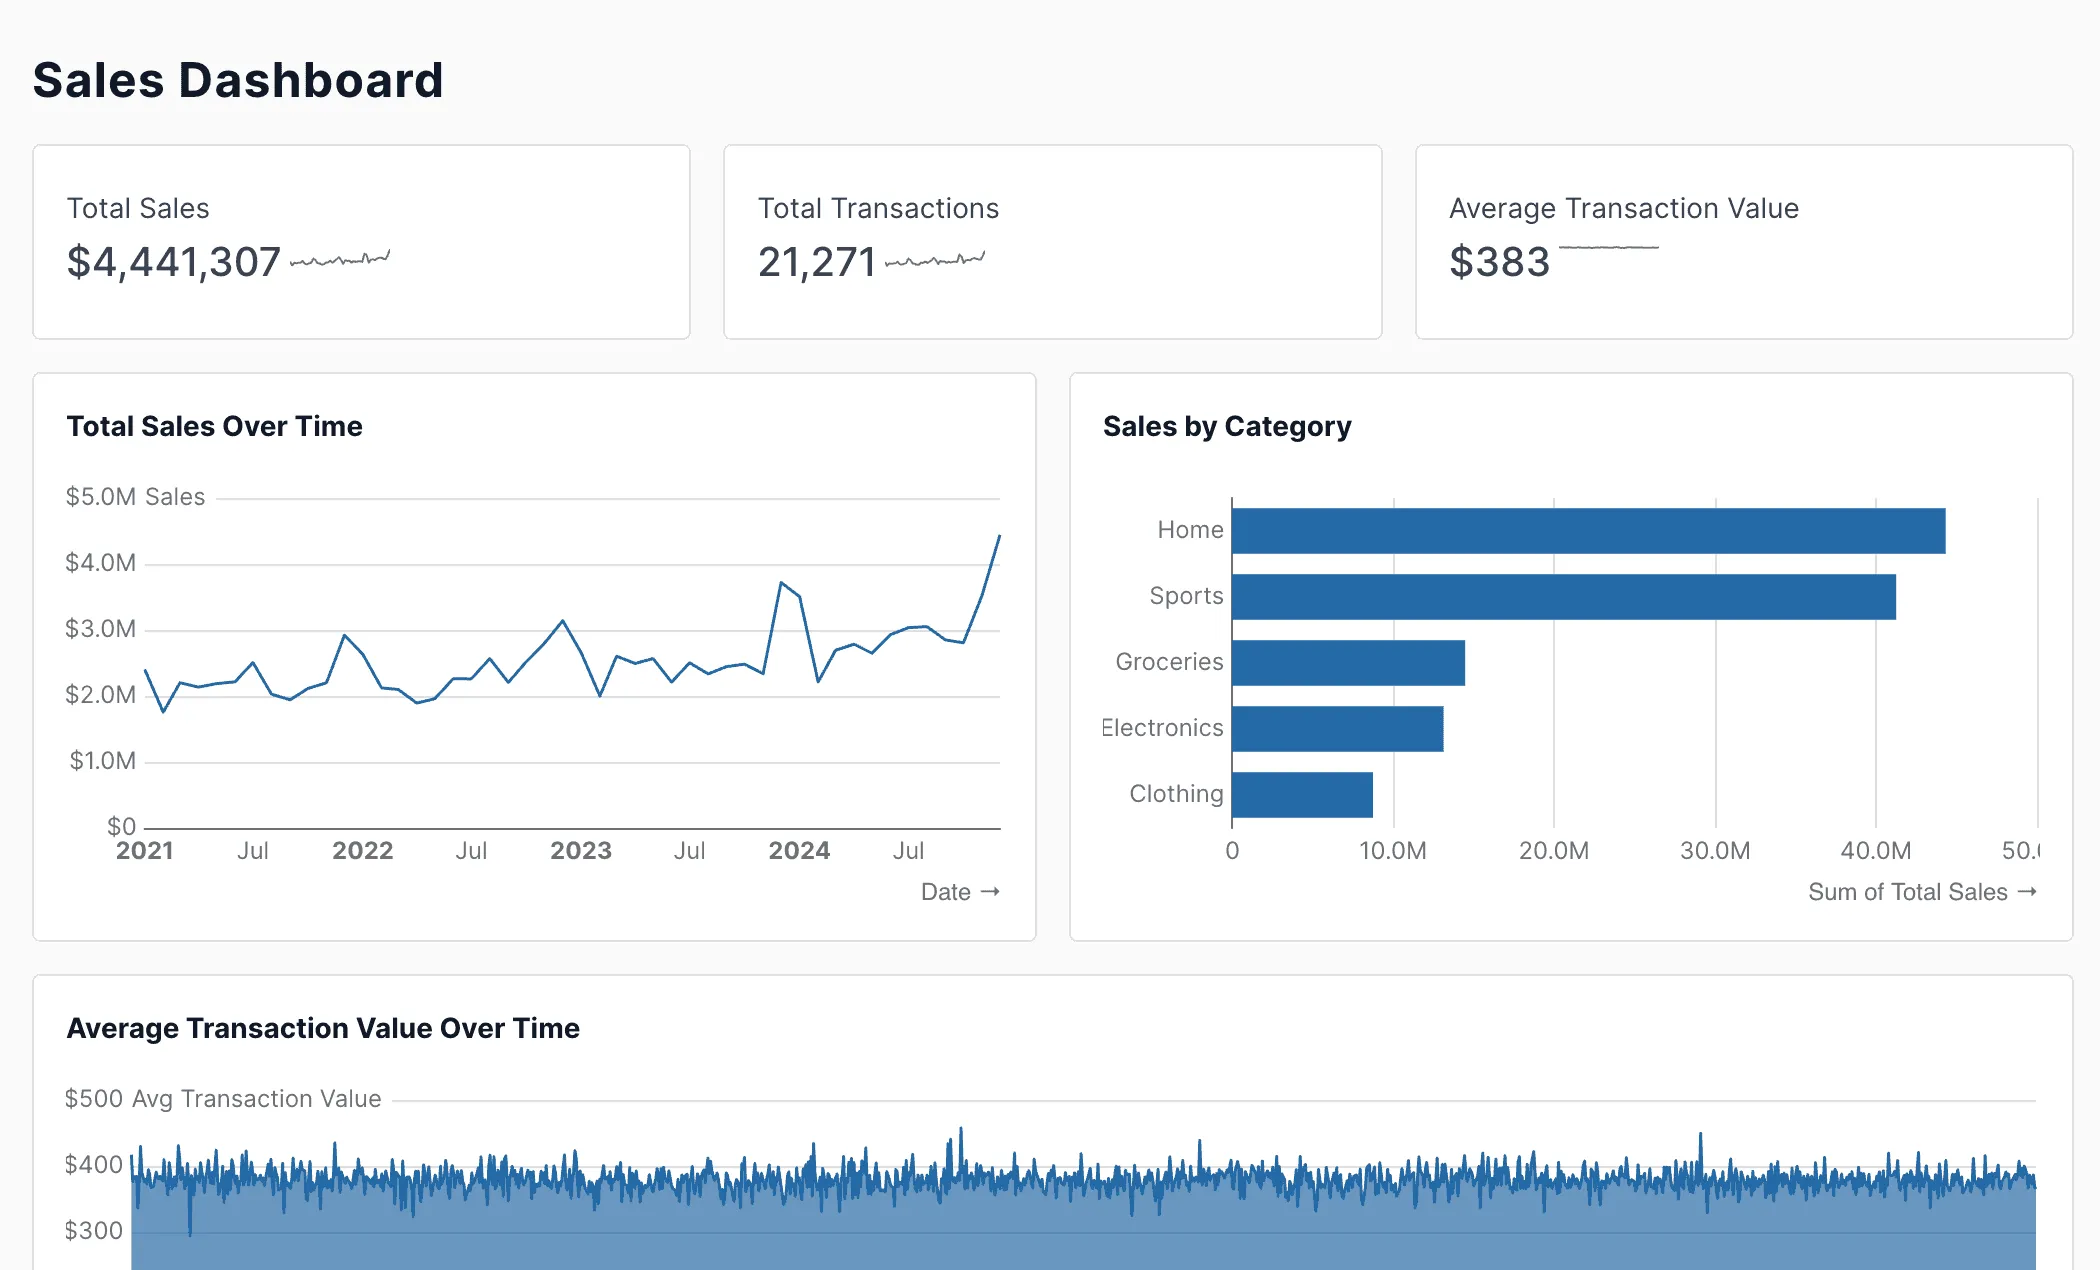
Evidence product dashboard and interface

Frequently asked questions

What is Evidence?

Evidence is a code-based business intelligence (BI) tool that allows users to create Markdown reports and visualize data using various statistical methods.

How much does Evidence cost?

Evidence charges one flat price for unlimited users rather than per seat. Team is $2,500 per month, billed monthly, and Enterprise is quote-only. A 30-day trial is offered.

Is Evidence better than Tableau for business intelligence?

While both tools offer robust BI capabilities, Evidence is specifically designed for users who prefer a code-based approach and Markdown reports. It may be more suitable for users with experience in data analysis and programming languages like Python or R.

Can I use Evidence to create interactive dashboards?

Yes, Evidence allows you to create interactive dashboards using various visualization tools and statistical methods. This enables users to explore their data in a more dynamic and engaging way.

Is there a free version of Evidence that I can try out?

Yes, we offer a free plan with limited features, allowing you to test the tool and its capabilities before upgrading to a paid plan.

Related BI Platforms

Other BI platforms in the catalog. Same kind of product, not a substitution recommendation.