300+ Tools CoveredSource Data Updated Weeklydates

Tool intelligence profile

Redash

Use Redash to connect to any data source (PostgreSQL, MySQL, Redshift, BigQuery, MongoDB and many others), query, visualize and share your data to make your company data driven.

Status source →
Type
BI Platform
Deployment
Cloud or self-hosted
Last updatedSeptember 21, 2026Open Source
Community maintainedStatus confirmed

Redash is maintained by volunteers, not by its owner

Databricks acquired Redash in June 2020 and shut the hosted Redash Cloud service down on 30 November 2021. Databricks-funded development on the open-source project wound down afterwards, and since late 2023 it has been maintained by a small group of volunteers. It still ships: v26.3.0 was released on 2 March 2026, at roughly one release a year. Redash remains free, Apache-2.0 and self-hostable; what changed is who decides its direction and how fast it follows the databases it connects to.

Source

Editor's Take

We recommend Redash for small, SQL-capable data teams that want an open-source BI layer to connect sources such as PostgreSQL, BigQuery, and MongoDB, then build and share query-driven visualizations without licensing fees. It is a strong fit for cost-sensitive internal analytics, but teams needing managed enterprise support or advanced governed self-service BI may prefer a commercial alternative such as Looker; the available context does not establish Redash’s enterprise-scale adoption or support maturity.

— Egor Burlakov, Editor

Evaluate Redash

Comparisons

Redash: product and architecture

Our verdict: Redash is a strong choice for SQL-fluent teams that want an open-source dashboarding layer without committing to a proprietary BI subscription. This Redash review finds its best fit in organizations where analysts and data engineers already work directly with databases and want to turn those queries into shared, refreshable dashboards. It is not the best choice when governance, polished semantic modeling, or sophisticated user administration is the primary requirement.

Redash connects to data sources including PostgreSQL, MySQL, Redshift, BigQuery, MongoDB, and others, then provides querying, visualization, dashboarding, and sharing in one product. Databricks acquired Redash in June 2020. Its public GitHub repository has 28,745 stars, uses Python as its primary language, and lists BSD-2-Clause as its license; those are useful public adoption signals, but they should not be treated as proof of enterprise-scale deployment.

Overview

Redash is a business-intelligence tool built around a straightforward workflow: connect a data source, write a query, turn the output into a visualization, and publish it on a dashboard. That workflow is its core advantage. Instead of asking data teams to adopt a separate modeling language or a highly managed reporting environment, Redash starts with the SQL work many analytics teams already perform.

The product’s positioning is particularly clear for teams that want data access to remain close to the source. A PostgreSQL, MySQL, Redshift, BigQuery, or MongoDB query can become a reusable reporting asset without requiring a new proprietary analytics layer. This makes Redash practical for operational reporting, internal KPIs, and stakeholder dashboards where query transparency matters.

Redash is open source under the BSD-2-Clause license and is available as self-hosted software for free. The repository’s latest listed release is v26.3.0, dated March 2, 2026, and the repository was last pushed on August 10, 2026. Those activity signals matter for technical evaluation, although teams should still validate their own deployment, security, maintenance, and support requirements.

We recommend Redash for data teams that value direct SQL access, low licensing cost, and dashboard sharing over extensive enterprise BI controls. Choose a more governed platform instead if your primary users are nontechnical business users who need heavily curated datasets, complex permissions, or a broad administration experience. Redash is most compelling when its simplicity is a deliberate operating model, not a workaround for missing data-management processes.

Key Features and Architecture

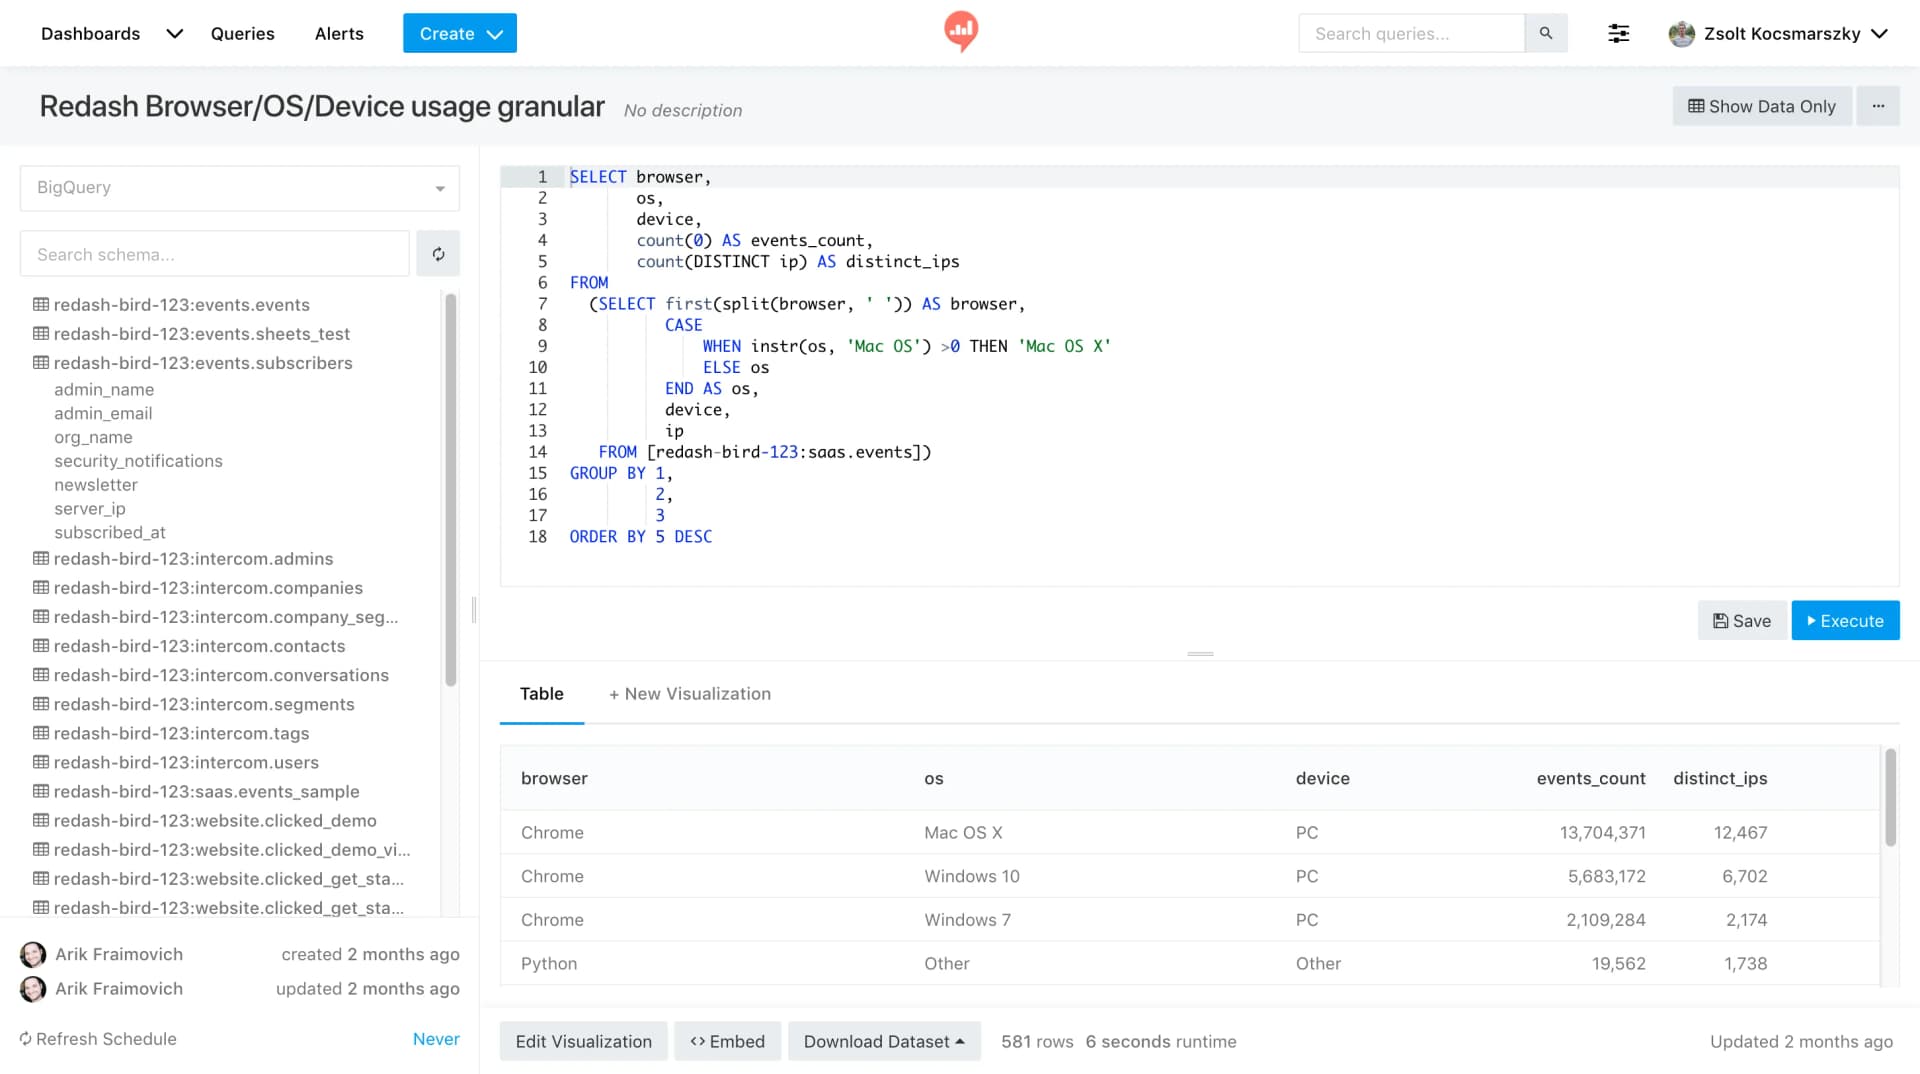
Redash centers its authoring experience on an online SQL editor. Users can browse a schema, click to insert fields, and create reusable query snippets, which reduces repetitive query construction while preserving SQL as the interface. This is technically important because it keeps the logic visible to analysts and engineers rather than hiding it behind generated queries or an opaque visual layer.

The tool connects to multiple data-source types, including PostgreSQL, MySQL, Redshift, BigQuery, and MongoDB. That breadth lets a team use one dashboarding interface across relational warehouses, transactional databases, and document-oriented data stores. The trade-off is that Redash’s value depends on the quality, availability, and access controls of the connected sources; it does not remove the need to design reliable underlying data.

Visualization is the next layer in the architecture. Query results can be turned into visualizations and arranged on dashboards, with drag-and-drop placement and resizing for individual visualizations. This enables teams to assemble a single operational view from multiple queries, but dashboard quality remains dependent on good query design, stable column naming, and deliberate metric definitions.

Dashboard refresh scheduling is another important capability. Redash can schedule refreshes from connected data, allowing dashboards to update without someone manually rerunning each query. This supports recurring reporting, but it also introduces an operational responsibility: teams should control expensive queries and review whether refresh schedules are appropriate for the data systems they connect.

Sharing is built directly into the product. Redash supports dashboard sharing through a single-click secret URL for peers or clients, which is useful for lightweight distribution outside a dashboard author’s immediate workspace. That convenience has a clear security trade-off: teams should treat secret URLs as access mechanisms that require deliberate governance and should not confuse simple sharing with a comprehensive external-access policy.

The platform also lists an API, alerts, and user management among its features. These capabilities extend Redash beyond static charts: APIs can support programmatic interaction, alerts can surface query-driven changes, and user management provides a baseline for access administration. However, user feedback specifically identifies user management and the management module as weaknesses, so organizations with strict role design or complex administration should validate those areas in a real deployment before standardizing on Redash.

Ideal Use Cases

Redash works especially well for a data team of roughly 3 to 15 analysts and engineers that already writes SQL against a warehouse or production-adjacent reporting database. For example, a SaaS company using BigQuery for product and customer analysis can let analysts build recurring adoption, retention, and support dashboards from saved SQL queries. The team retains query-level visibility while giving leadership a common dashboard destination.

A second strong use case is operational reporting for a company with data spread across PostgreSQL, MySQL, Redshift, and MongoDB. A data engineer can connect the relevant sources, while analysts create source-specific queries and compose visualizations into dashboards for internal teams. Redash is useful here because the organization does not need every question forced into one source before stakeholders can see a consolidated reporting surface.

A third use case is a client-facing or cross-functional reporting package where quick, controlled sharing is more important than a custom analytics portal. The secret-URL dashboard-sharing feature allows a team to distribute a dashboard with a single click to peers or clients. We would use this only when the organization has made an intentional decision about what information can be exposed through that sharing method.

Redash is also suitable for teams that want to minimize license spend while maintaining control of their deployment. Self-hosting under BSD-2-Clause is attractive for organizations comfortable operating their own data tools and accepting responsibility for upgrades, configuration, and access controls. The price advantage is real, but it shifts work toward the team rather than eliminating it.

Do not use Redash if your delivery model depends on advanced user administration being effortless or if stakeholders need an interface that shields them from SQL-led reporting practices. The 8.1/10 user rating across 17 reviews is respectable, but the same user feedback calls out user management, dashboarding, column names, and complex logic as pain points. Redash is strongest when technically capable owners can standardize query patterns and dashboard conventions.

Strengths & Trade-offs

Redash’s strengths are tangible when a data team wants a SQL-first reporting workflow rather than an abstracted BI environment.

  • The online SQL editor supports schema browsing and click-to-insert behavior, helping analysts write queries while keeping the resulting logic inspectable and reusable.
  • Query snippets can be created and reused, which is valuable for teams that repeatedly apply common SQL patterns across dashboards.
  • Redash supports connections to PostgreSQL, MySQL, Redshift, BigQuery, MongoDB, and other sources, making it useful when reporting spans more than one database technology.
  • Dashboards support drag-and-drop layout, visualization resizing, and scheduled refreshes, giving teams a practical path from a query result to recurring reporting.
  • Secret-URL dashboard sharing is a low-friction mechanism for distributing dashboards to peers or clients.
  • The BSD-2-Clause, self-hosted free model gives technically capable organizations deployment control without a stated software-license charge.
  • Real user feedback gives Redash an 8.1/10 rating from 17 reviews, with users specifically identifying variety of data sources, simple UI, detailed reporting, drag and drop, real-time use, and different dashboards as strengths.

The limitations are equally important, especially for organizations that need strong governance at scale.

  • User management is specifically identified by users as a weakness, so Redash is a poor default when access administration is central to the BI operating model.
  • Users also call out the management module, which reinforces the need to test administrative workflows rather than assuming open-source deployment will be simple to govern.
  • Column names are a reported pain point; teams should enforce query-output conventions because inconsistent field labels can degrade dashboard clarity.
  • Complex logic is identified as a weakness, which means Redash is less attractive when business metrics require intricate logic that must be centrally modeled and consistently reused.
  • Dashboarding and interface friendliness are both mentioned among user weaknesses, despite the availability of drag-and-drop dashboards. The practical lesson is that functional dashboard assembly does not guarantee a polished stakeholder experience.
  • “Pull data” is another user-reported concern, so teams should validate query and retrieval behavior against their own sources before committing operational reports to Redash.
Redash pricing

Starting at
Free (open source)
Free access
Open source

View full Redash pricing intelligence →

Alternatives to Redash

The reviewed substitutes for Redash among the BI platforms, and what would make each one the better answer.

Direct alternatives

Reviewed substitutes: products bought for the same job, where a team picks one.

Metabase
Both are BI platforms answering the same purchase: dashboards, exploration and governed metrics over a warehouse. Independent 2026 buyer's guides and vendor head-to-heads place them on one shortlist, and teams license one, so the comparison is a substitution rather than an architecture question.Applies to: Choosing the BI platform a team will license for dashboards and self-service exploration.
Lightdash
Two products of the same kind on one reviewed shortlist, answering the same purchase. open-source BI round-ups compare these projects directly for the self-hosting decision, and a team adopts one, so the comparison is a substitution.Applies to: Choosing between these two for the open source bi decision.
Apache Superset
Both are BI platforms answering the same purchase: dashboards, exploration and governed metrics over a warehouse. Independent 2026 buyer's guides and vendor head-to-heads place them on one shortlist, and teams license one, so the comparison is a substitution rather than an architecture question.Applies to: Choosing the BI platform a team will license for dashboards and self-service exploration.
Looker
Both are BI platforms answering the same purchase: dashboards, exploration and governed metrics over a warehouse. Independent 2026 buyer's guides and vendor head-to-heads place them on one shortlist, and teams license one, so the comparison is a substitution rather than an architecture question.Applies to: Choosing the BI platform a team will license for dashboards and self-service exploration.
Tableau
Both are BI platforms answering the same purchase: dashboards, exploration and governed metrics over a warehouse. Independent 2026 buyer's guides and vendor head-to-heads place them on one shortlist, and teams license one, so the comparison is a substitution rather than an architecture question.Applies to: Choosing the BI platform a team will license for dashboards and self-service exploration.
See detailed alternatives analysis

Why Teams Look for Redash Alternatives

Redash earned its reputation as a lightweight, SQL-first query and visualization tool that teams could self-host for free under a BSD-2-Clause license. Its appeal was straightforward: connect to virtually any data source, write SQL, build dashboards, and share them across your organization. Databricks acquired Redash in 2020, and while the open-source project remains active with releases continuing into 2026, the acquisition introduced uncertainty about long-term independent development priorities.

We see teams moving away from Redash for several recurring reasons. The user management and permissions system is frequently cited as a pain point, especially as organizations scale beyond a small data team. Complex dashboard logic can become cumbersome to maintain, and the interface, while functional, has not kept pace with the polish and self-service capabilities that newer BI tools offer. Teams that started with Redash for its simplicity often outgrow it when they need richer visualizations, embedded analytics, semantic layers, or governed self-service for non-technical stakeholders.

If your data team spends more time working around Redash limitations than actually analyzing data, it is worth evaluating the alternatives below.

Top Redash Alternatives

Metabase

Metabase is the closest open-source competitor to Redash and the one we recommend most often for teams that want to stay in the open-source ecosystem while gaining a more approachable interface. Where Redash is SQL-first, Metabase adds a visual query builder that lets non-technical users explore data without writing a single query, while still offering a full SQL editor for power users. With a community rating of 8.4/10 across 66 reviews and over 46,900 GitHub stars, Metabase has a sizable community, alongside Redash (8.1/10 across 17 reviews, roughly 28,500 GitHub stars).

Metabase Cloud starts at $100/mo for the Starter tier and $575/mo for Pro, with an Enterprise tier available. The open-source self-hosted version remains free. Its stronger permissions model, drill-through interactivity, and Metabot AI assistant for natural language querying address several of the gaps that push teams away from Redash.

Apache Superset

Apache Superset is the heavyweight open-source alternative, boasting over 72,400 GitHub stars and backing from the Apache Software Foundation. It ships with 40-plus pre-installed visualization types, a no-code chart builder alongside a capable SQL IDE, and a plugin architecture for custom visualizations. Superset is entirely free under the Apache 2.0 license.

We recommend Superset for teams with dedicated data engineering resources. The trade-off is a steeper learning curve and more involved deployment compared to Redash or Metabase. Infrastructure management, caching configuration, and security setup require real investment. For organizations that can absorb that operational overhead, Superset delivers a visualization library and scalability that Redash cannot match.

Lightdash

Lightdash targets a specific and growing niche: teams that have already invested in dbt as their transformation layer. It connects directly to your dbt project, inheriting your models and metrics definitions so that the semantic layer stays in sync with your data transformations. This dbt-native approach eliminates the metric duplication problem that plagues teams using Redash alongside dbt.

Lightdash positions itself as an AI-native BI platform with agentic workflows for building dashboards and answering questions through a governed semantic layer. The open-source self-hosted version is free, while Cloud Pro runs at $3,000/mo with unlimited user seats and no per-seat pricing. For dbt-centric teams frustrated by the disconnect between their transformation layer and Redash dashboards, Lightdash offers a compelling path forward.

Power BI

Power BI is the pragmatic choice for organizations already embedded in the Microsoft ecosystem. Its free tier provides basic functionality for individual users, with Pro at $9/mo per user and Premium at $39/mo per user. Compared to Redash, Power BI offers far richer visualization options, natural language querying, and deep integration with Excel, Azure, and Microsoft 365.

We recommend Power BI when the primary users are business analysts rather than data engineers. The drag-and-drop interface and extensive template library lower the barrier to self-service analytics considerably. The trade-off is vendor lock-in to the Microsoft stack and per-seat pricing that can escalate with large teams.

Looker

Looker, now part of Google Cloud, takes a fundamentally different approach to BI through its LookML semantic modeling language. Instead of each analyst writing ad-hoc SQL, teams define reusable data models and metrics in a governed layer. With an 8.4/10 rating across 457 reviews, Looker has strong enterprise credibility. Standard plans start at $99/mo and Premium at $299/mo, with custom Enterprise pricing available.

Looker is the right move for organizations that need strict governance over their metrics and definitions. It excels in environments where consistency across reports matters more than speed of individual dashboard creation. However, LookML introduces a proprietary modeling language that requires dedicated expertise, making Looker a heavier commitment than Redash.

Other Alternatives Worth Considering

KNIME offers a visual workflow builder for data science and analytics pipelines, free for personal use with paid options starting at $19/mo. It suits teams that need more than BI, extending into data preparation and machine learning workflows.

Cube provides a semantic layer and API-first analytics platform, useful for teams building custom analytics applications rather than traditional dashboards. Pricing requires contacting their sales team.

Holistics combines data modeling, transformation, and visualization in a self-service BI platform. It targets teams that want to build a semantic layer while empowering business users with self-service capabilities.

Sisense delivers AI-powered embedded analytics with pricing starting at $999/mo, aimed at SaaS companies that need to embed analytics directly into their products.

Tableau remains the industry standard for visual analytics, with Viewer seats starting at $15/user/month and Creator seats at $75/user/month. It offers the richest visualization capabilities on this list but at a premium price point.

How to Choose the Right Alternative

The right Redash replacement depends on your team composition, technical capabilities, and what specifically frustrates you about Redash.

If you want to stay open-source and self-hosted, Metabase and Apache Superset are your strongest options. Metabase wins on ease of use and faster time-to-value. Superset wins on visualization depth and extensibility, provided you have the engineering resources to manage it.

If your stack is built around dbt, Lightdash deserves serious consideration. The native integration with dbt models eliminates the metric consistency problem that teams using Redash alongside dbt encounter constantly.

If self-service for non-technical users is the priority, Power BI and Metabase lead the field. Both offer visual query builders and intuitive interfaces that minimize the SQL dependency that defines the Redash experience.

If governance and metric consistency matter most, Looker and Cube provide semantic layers that enforce a single source of truth for business definitions. This is the opposite end of the spectrum from Redash, where anyone can write any SQL query without centralized governance.

If you need embedded analytics in a SaaS product, Sisense and Cube are purpose-built for that use case, while Metabase also offers a capable embedded analytics SDK.

We suggest starting with your biggest pain point. If it is the user interface and self-service gap, lean toward Metabase or Power BI. If it is the lack of a semantic layer, look at Looker, Lightdash, or Cube. If it is simply needing more visualization options while staying open-source, Superset is the natural upgrade.

Redash vs Top Alternatives: Comparison

Redash connects to a broad range of data sources including PostgreSQL, MySQL, Redshift, BigQuery, and MongoDB, and its SQL editor with schema browsing and auto-complete remains genuinely good for SQL-proficient users. Where it falls short is in everything surrounding that core query experience.

Metabase matches Redash on data source connectivity while adding the visual query builder, drill-through navigation, and scheduled delivery that Redash lacks. Metabase also offers stronger caching and result management out of the box. For teams comparing these two head-to-head, Metabase is the more complete package unless your workflow is exclusively SQL-based and you prefer Redash's lighter footprint.

Apache Superset surpasses both on raw visualization capability with its 40-plus chart types and plugin architecture. It also handles larger datasets more gracefully through its architecture. The cost is operational complexity; Superset deployments require more care and feeding than either Redash or Metabase.

Looker and Lightdash represent a philosophical departure. Rather than ad-hoc SQL queries, they enforce structured semantic layers. This creates more upfront work but pays dividends in metric consistency across an organization. Teams that have experienced conflicting numbers across different Redash dashboards will appreciate this governed approach.

Power BI and Tableau occupy the commercial end of the spectrum, trading open-source flexibility for polish, enterprise support, and richer out-of-the-box capabilities. Both handle self-service analytics for business users far better than Redash, which was always designed with SQL-comfortable data teams in mind.

Migration Tips from Redash

Start by auditing your existing Redash environment. Catalog every active query, dashboard, and alert, and identify which ones are actually used versus abandoned. Most Redash instances accumulate significant dashboard sprawl, and migration is an opportunity to prune.

For moves to Metabase or Superset, your existing SQL queries transfer almost directly since both tools support raw SQL alongside their visual builders. Recreate your most-used dashboards first and validate the numbers against your Redash originals before decommissioning anything.

If migrating to a semantic layer tool like Looker or Lightdash, plan for a longer transition. You will need to translate your ad-hoc SQL patterns into governed model definitions. Start with your highest-traffic dashboards and most critical metrics, building the semantic layer incrementally rather than attempting a full conversion at once.

Data source connections generally transfer smoothly since most BI tools support the same databases Redash connects to. Test each connection in your target platform early in the process to surface any driver or authentication differences.

Scheduled queries and alerts require special attention. Map your Redash alert configurations to the equivalent functionality in your new tool, and confirm that stakeholders continue receiving the notifications they depend on.

Finally, run both systems in parallel for at least two to four weeks. This overlap period lets your team build confidence in the new tool while maintaining Redash as a fallback. Cut over fully only after your critical dashboards are validated and your team is comfortable with the new workflow.

What users say about Redash

Historical review enrichment from TrustRadius.

Pros

  • Variety of data
  • Drag and drop
  • Different dashboards
  • Easy to setup

Cons

  • User friendly interface

Public signals

About these signals

Verified factual signals from public sources. They indicate observable activity or interest, not total adoption, product quality, or cost.

14 GitHub commits 90d28.8k GitHub stars0 vulnerabilities across 1 packageOpenSSF score 6.1/10

See all signals from 9 sources
Source
Signals
Last updated
GitHub
Commits 90d:14Stars:28.8k↑14
September 21, 2026
Docker Hub
Pulls:100.1M↑526.0k
September 21, 2026
PyPI
Weekly downloads:6.9k↑718
September 21, 2026
Google Trends
Search interest:Top 70%overallTop 75%in Business Intelligence
September 21, 2026
Hacker News
Matching stories, 90d:2
September 21, 2026
Product Hunt
Comments:1Reviews:0Votes:9
September 21, 2026
Stack Overflow
Questions:133
September 21, 2026
OSV
Package vulnerabilities:0 vulnerabilitiesacross 1 package

PyPI · redash-toolbelt@0.1.9

September 21, 2026
Security score:6.1/10

github.com/getredash/redash

September 21, 2026
Redash product dashboard and interface

Frequently asked questions

What is Redash?

Redash is an open-source data visualization and dashboarding tool that allows users to create interactive dashboards and reports.

Is Redash free?

Yes, Redash is completely free and open-source, with no costs or licensing fees.

How does Redash compare to Tableau?

While both tools offer data visualization capabilities, Redash is more geared towards developers and offers greater customization options and flexibility.

Can I use Redash for real-time analytics?

Yes, Redash supports real-time analytics through its support of streaming data sources such as Apache Kafka and Amazon Kinesis.

What are some common use cases for Redash?

Redash is commonly used for business intelligence, reporting, and data analysis in industries such as finance, healthcare, and e-commerce.

Does Redash have a user-friendly interface?

Yes, Redash has a simple and intuitive web-based interface that allows users to create and manage dashboards without requiring extensive technical knowledge.

Related BI Platforms

Other BI platforms in the catalog. Same kind of product, not a substitution recommendation.