300+ Tools CoveredSource Data Updated Weeklydates

Tool intelligence profile

Looker

Enterprise BI platform with LookML semantic modeling and embedded analytics

Visit Site →
Type
BI Platform
Deployment
Cloud (managed)
Last updatedSeptember 20, 2026Google

Editor's Take

We recommend Looker for mid-market and enterprise BI teams that need governed metrics through its LookML semantic layer and embedded analytics, and can support a paid platform with dedicated data-modeling ownership. It is a weaker fit for small teams seeking quick self-service dashboards with minimal modeling overhead; the available context does not provide pricing or customer-scale evidence, so buyers should obtain a quote and compare implementation effort with Tableau or Power BI.

— Egor Burlakov, Editor

Evaluate Looker

Popular comparisons

See all 20 Looker comparisons

Looker: product and architecture

Looker is the right choice when governed metrics matter more than fast, analyst-led dashboard experimentation. In this looker bi platform review, our verdict is clear: we recommend Looker for organizations willing to invest in LookML so they can centralize business logic, standardize definitions, and serve analytics through a controlled semantic layer. Avoid it if your primary goal is immediately intuitive self-service visualization with minimal modeling work.

Overview

Looker is an enterprise business-intelligence and semantic-modeling platform, now part of Google Cloud. Its central proposition is not simply dashboard creation: Looker uses LookML to define reusable data models and metrics, then exposes those governed definitions through explores, dashboards, and APIs. That architecture makes Looker a serious option for data teams that have repeatedly dealt with conflicting metric definitions across reports.

The platform is positioned around governed data, composable BI, business-friendly AI-powered analytics, cloud-first infrastructure, APIs, and an open semantic model. Google describes Looker as an API-first platform and highlights “Google-easy dashboarding,” but the evaluator should focus on the trade-off behind that message: the governance layer creates control, while the modeling discipline creates implementation work. Looker is not a lightweight reporting tool that becomes governed by accident.

Google was recognized as a Leader in Gartner’s 2025 Magic Quadrant for Analytics and Business Intelligence Platforms. That is useful market context, not proof that Looker will fit a specific data stack or team. The supplied evidence does not include implementation timelines, supported warehouse list, benchmark results, or adoption counts, so those should be validated directly during procurement.

Looker’s strongest fit is a data organization where analytics engineering has a defined role. When data engineers and analytics engineers can maintain LookML as shared analytical infrastructure, business users can explore modeled data without recreating raw-SQL logic in every dashboard. The cost is that Looker asks teams to formalize their definitions before they get the full benefit of self-service analytics.

Key Features and Architecture

Looker’s core architectural feature is LookML, a modeling language used to define reusable data models and metrics. Rather than allowing each dashboard author or analyst to write separate raw SQL for common measures, teams can centralize the logic in a governed semantic layer. This is the feature that distinguishes Looker from a dashboard-first deployment: it turns metric definitions into managed analytical assets rather than scattered report logic.

Key platform capabilities include:

  • LookML semantic modeling: Data teams define reusable business logic and metrics in LookML. This lets an organization establish a common definition once and expose it repeatedly, reducing the risk that different explores or dashboards calculate the same business measure differently.

  • Governed explores: Looker exposes modeled data through explores, giving users a structured way to analyze data that has already been shaped by the semantic layer. The strength is controlled access to approved business logic; the trade-off is that an explore is only as useful as the LookML model behind it.

  • Dashboards: Looker provides dashboards for delivering business insights from governed, modeled data. Dashboarding is an output of the modeled layer rather than the entire product strategy, which is important for teams deciding whether they need governance or primarily visual storytelling.

  • API-first and composable BI: Google positions Looker as an API-first platform with composable BI. That matters for teams that need analytics to be delivered through application-oriented interfaces rather than only through a standalone BI destination.

  • Embedded analytics: Looker is described as supporting embedded analytics. This makes it relevant where analytics must be delivered as part of a product or operational experience, although the supplied material does not provide technical details on embedding methods, deployment patterns, or performance behavior.

  • AI-powered applications and analytics: Google positions Looker around AI-powered applications and business-friendly AI-powered analytics using governed, modeled data. The important qualification is that the available source material names the positioning but does not specify model types, feature limits, or operational controls.

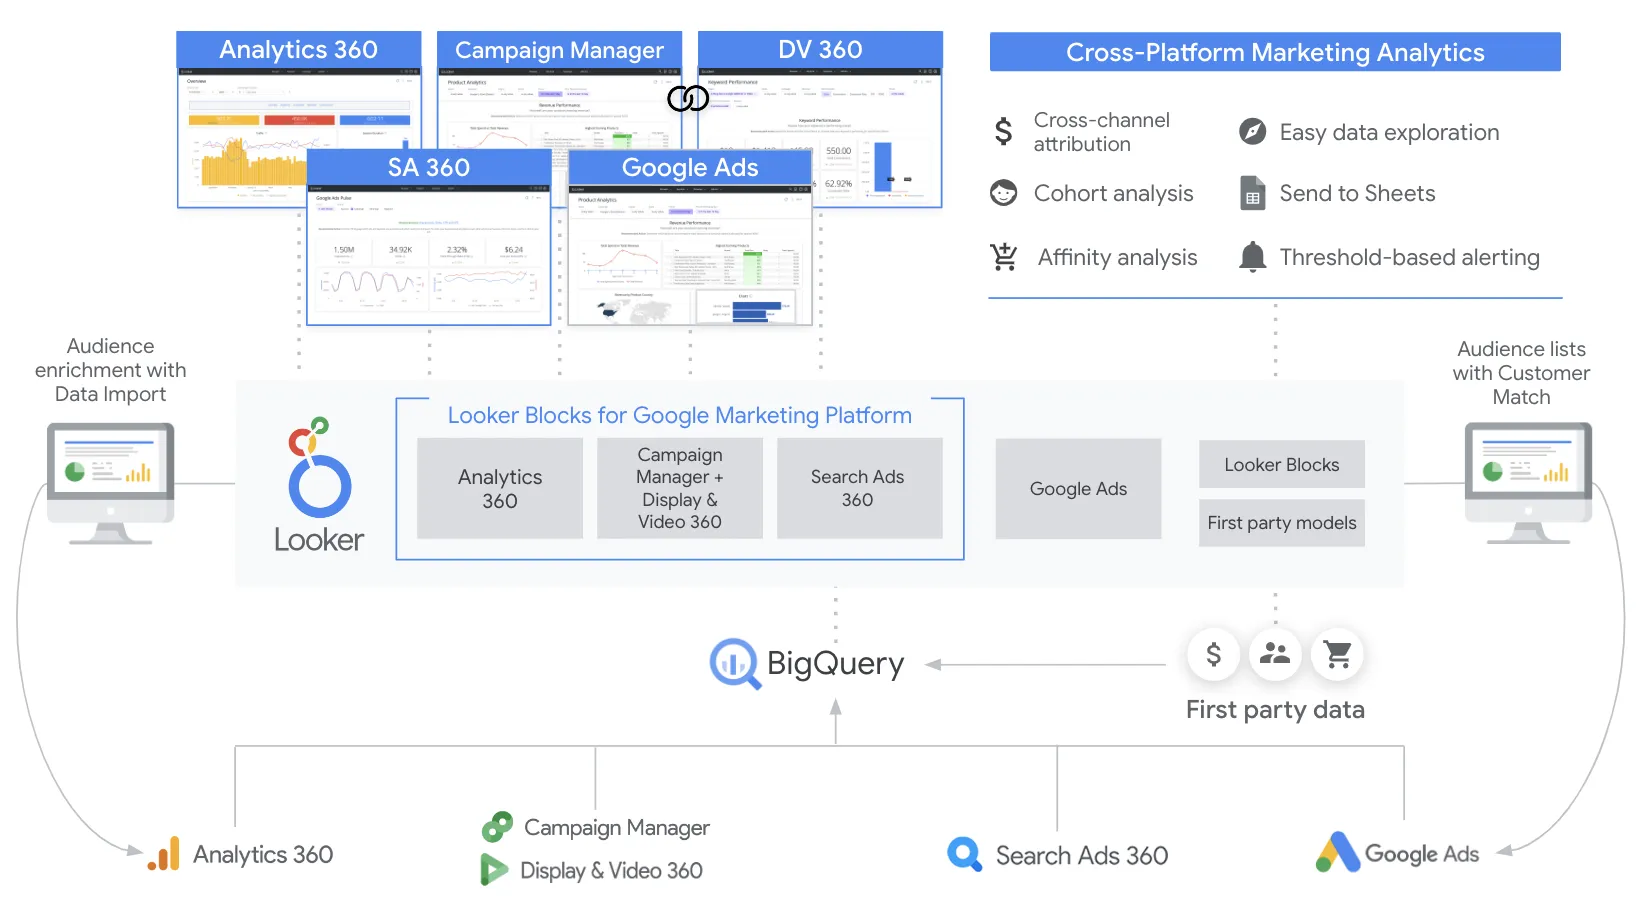
  • Marketplace content: Looker Marketplace includes applications, blocks, and custom plug-ins. The supplied examples include optimized SQL patterns, fully built-out data models, custom visualizations, weather data, demographic data, Cloud Cost Management for Google Cloud, and a Contact Center as a Service example connected to CCAI Insights.

The Marketplace is valuable because it can accelerate implementation with reusable components. It does not remove the need to understand and govern the underlying model; importing a block without ownership of its metric logic simply moves complexity into a less visible place. The provided Looker Story video is listed as 1 minute and 43 seconds long, which is useful orientation material but not adequate evidence for a technical architecture decision.

The user feedback aligns with this architecture. Across 457 reviews, Looker has a user rating of 8.4/10, and users specifically cite data sources, real-time use, data warehouses, drag-and-drop interaction, and the user interface as strengths. At the same time, users cite a learning curve, slower behavior at times, long load times, data-source concerns, limited visualization options, and an experience that can be not intuitive.

Ideal Use Cases

Looker is best for a centralized data team that owns analytical definitions for a multi-department organization. A practical scenario is a data engineering and analytics engineering group supporting finance, operations, product, and commercial users who need the same modeled metrics in multiple explores and dashboards. In that setting, LookML gives the team a durable place to define shared logic instead of allowing each group to maintain its own raw-SQL version.

A second strong use case is embedded analytics in a software product or internal operational application. Looker’s API-first and composable BI positioning, together with its embedded analytics capability, makes it relevant when a team wants governed analysis to be part of an application experience. We recommend Looker for product and platform teams only when they also have clear ownership for the LookML model; embedding ungoverned analytics does not solve the underlying consistency problem.

A third use case is a cloud cost-management program that needs reporting across complex multicloud or hybrid-cloud billing. The supplied product material explicitly describes the challenge of multi-provider billing and identifies out-of-the-box reporting for day-to-day needs and longer-term optimization initiatives. Looker Marketplace also includes a Cloud Cost Management block for analyzing spend across Google Cloud resources to support budget decisions.

Looker can also fit organizations building reusable analytics components rather than one-off reports. Marketplace blocks may provide optimized SQL patterns, data models, custom visualizations, weather data, and demographic data that shorten the path from governed model to usable analysis. This is especially relevant when an analytics engineering team has a repeatable implementation pattern and needs accelerators without abandoning its own semantic-model standards.

Don’t use Looker if your organization needs a reporting tool that nontechnical users can deploy and govern without an up-front modeling commitment. The real user feedback specifically flags a learning curve, time to learn, and a sometimes not-intuitive experience. Also avoid selecting Looker solely because it offers dashboards: the supplied feedback identifies visualization options as a weakness, so teams whose buying decision is driven chiefly by visualization breadth should evaluate alternatives against that requirement directly.

Strengths & Trade-offs

Looker’s advantages are substantial when a data team treats the semantic layer as shared infrastructure rather than as a dashboard configuration detail. Its weaknesses are equally concrete: user feedback shows that the path from raw data to a mature Looker deployment can involve learning, load-time, and visualization compromises. The 8.4/10 rating across 457 reviews is positive evidence, but it should not erase the recurring limitations users identified.

Pros

  • LookML centralizes reusable business logic. Looker is designed so teams can define models and metrics once rather than rely on every analyst or dashboard author to reproduce raw SQL. This is a specific governance advantage for organizations with recurring metric-definition conflicts.

  • Explores, dashboards, and APIs expose governed data in multiple delivery modes. A single modeled foundation can support analysis, dashboard consumption, and API-oriented use cases. The benefit is consistency; the cost is the need to maintain the underlying semantic model.

  • Its API-first, composable BI position is useful for embedded analytics. Looker is not limited to a conventional reporting destination, which makes it relevant to teams building AI-powered applications or embedded analytical experiences. This is more useful for product-oriented analytics than for teams that only need ad hoc reports.

  • Marketplace content can reduce implementation repetition. Available blocks include optimized SQL patterns, fully built-out data models, custom visualizations, weather data, demographic data, and cloud-cost content. These are practical accelerators when teams still review and own the logic they deploy.

  • Users specifically recognize the data-warehouse and data-source experience. In the supplied feedback, real-time use, data sources, data warehouses, drag-and-drop interaction, the interface, ease of learning, and end-user usability are all named strengths. That gives Looker credibility beyond its product positioning.

Cons

  • LookML introduces a real learning curve. Users explicitly report that Looker takes time to learn, and that is consistent with a platform built around semantic modeling. Teams without analytics-engineering ownership may find that governance becomes a bottleneck rather than an advantage.

  • Performance can be inconsistent for users. Reviewers cite Looker as slow at times and say it can take a long time to load. The supplied data does not identify the cause or provide benchmarks, so buyers should test representative workloads rather than assume performance will meet expectations.

  • Visualization options are a stated weakness. Users identify visualization options as somewhat limited. That is a material constraint for organizations whose requirements depend on a broad visualization catalogue or highly specialized presentation formats.

  • The experience is not universally intuitive. “Not intuitive” and data-source concerns both appear in the supplied user weaknesses. This means Looker should not be selected solely on the assumption that drag-and-drop capabilities eliminate training or modeling design work.

  • No platform or per-user price is published. All three editions require a custom quote, and the only published rate is data-token overage. That makes total-cost comparison impossible until a buyer obtains a proposal.
Looker pricing

Starting at
Contact sales
Free access
No free option documented

View full Looker pricing intelligence →

Alternatives to Looker

The reviewed substitutes for Looker among the BI platforms, and what would make each one the better answer.

Direct alternatives

Reviewed substitutes: products bought for the same job, where a team picks one.

Tableau
Choose Tableau if your primary need is strong data visualization and your team already operates within the Salesforce ecosystem.Applies to: Choosing the BI platform a team will license for dashboards and self-service exploration.
Power BI
Choose Power BI if your organization runs on Microsoft infrastructure and you need the lowest per-user cost at enterprise scale.Applies to: Choosing between two products of the same kind for one job.
ThoughtSpot
Choose ThoughtSpot if your priority is enabling self-service analytics for non-technical business users without building dashboards for every question.Applies to: Choosing the BI platform a team will license for dashboards and self-service exploration.
Sisense
Choose Sisense if your core use case is embedding white-labeled analytics into a customer-facing SaaS product.Applies to: Choosing the BI platform a team will license for dashboards and self-service exploration.
Qlik Sense
Choose Qlik Sense if your analysis workflow depends on free-form data exploration across complex, interconnected datasets.Applies to: Choosing the BI platform a team will license for dashboards and self-service exploration.
See detailed alternatives analysis

If your team has outgrown Looker's LookML-centric workflow or you need a BI platform with a different cost structure, several Looker alternatives deserve serious evaluation. Looker, now part of Google Cloud, delivers strong semantic modeling and embedded analytics through its API-first architecture, but its annual-commitment pricing, steep learning curve, and tight coupling to the Google ecosystem push many organizations to explore other options. We evaluated the leading business intelligence platforms across architecture, pricing, self-service capabilities, and ecosystem fit to help you make that decision.

Top Alternatives Overview

Tableau remains the most widely adopted visual analytics platform in the BI space, with over 2,300 reviews and an 8.4/10 rating. Tableau excels at interactive data visualization with a drag-and-drop interface that analysts genuinely enjoy using, and it offers multiple deployment options: Tableau Cloud (SaaS), Tableau Server (self-hosted), and the newer Tableau Next platform with agentic analytics powered by Agentforce. Pricing is transparent and role-based, starting at $15/user/month for Viewers, $42 for Explorers, and $75 for Creators on Tableau Cloud Standard Edition. Enterprise Edition runs $35 for Viewers, $70 for Explorers, and $115 for Creators. Choose Tableau if your primary need is strong data visualization and your team already operates within the Salesforce ecosystem.

Power BI is Microsoft's answer to enterprise BI, and its tight integration with Microsoft 365, Azure, and the broader Microsoft Fabric data platform makes it the default choice for Microsoft-heavy organizations. Power BI offers a genuinely free tier for individual use, Pro at $14/user/month, and Premium Per User at $24/user/month. It handles petabyte-scale data through semantic modeling and provides Copilot AI features for natural-language report generation and DAX query assistance. Microsoft was positioned highest for Ability to Execute and furthest for Completeness of Vision in the 2025 Gartner Magic Quadrant for Analytics and Business Intelligence Platforms. Choose Power BI if your organization runs on Microsoft infrastructure and you need the lowest per-user cost at enterprise scale.

ThoughtSpot takes a fundamentally different approach to BI by leading with AI-powered natural language search. Users ask questions in plain English and get instant, governed answers on live data, which dramatically reduces the backlog of dashboard requests that plague traditional BI teams. ThoughtSpot's Essentials plan starts at $25/user/month for up to 50 users and 25 million rows of data, while the Pro plan runs $50/user/month supporting up to 1,000 users and 250 million rows. It holds an 8.5/10 rating across 206 reviews, with users consistently praising its ease of use for ad hoc analysis. Choose ThoughtSpot if your priority is enabling self-service analytics for non-technical business users without building dashboards for every question.

Qlik Sense differentiates itself through its proprietary Associative Engine, which indexes every possible relationship in your data rather than forcing users down predefined query paths. This approach surfaces insights that traditional BI tools miss because users are not limited to following pre-built hierarchies. Qlik Sense carries an 8.3/10 rating from over 1,000 reviews, reflecting its maturity and broad enterprise adoption, and it supports both cloud and on-premise deployments for organizations with strict data residency requirements. Pricing is custom and requires engaging their sales team. Choose Qlik Sense if your analysis workflow depends on free-form data exploration across complex, interconnected datasets.

Sisense focuses heavily on embedded analytics, positioning itself as the platform for companies that want to build data products and monetize analytics within their own applications. Sisense offers pro-code, low-code, and no-code flexibility with its In-Chip technology for processing large datasets efficiently. It carries a 7.4/10 rating across 131 reviews, and pricing uses a custom enterprise model. Choose Sisense if your core use case is embedding white-labeled analytics into a customer-facing SaaS product.

Mode Analytics combines SQL, Python, R, and visual analytics in a single collaborative platform purpose-built for data teams. Rather than competing as an enterprise-wide BI tool, Mode serves as the central analysis hub where data analysts write queries, build notebooks, and share interactive results with stakeholders. It holds a 9.0/10 rating, though from a smaller review base. Mode uses enterprise-style pricing based on team size. Choose Mode if your data team needs a code-first analytics environment that bridges the gap between raw SQL exploration and polished business reporting.

Architecture and Approach Comparison

The fundamental architectural divide among these platforms centers on how they handle data modeling and query execution. Looker's LookML semantic layer centralizes business logic in version-controlled code, which is powerful for governance but creates a real bottleneck: every metric definition change requires a developer to modify LookML files, and the initial setup can take weeks before business users see their first dashboard. Users consistently cite the learning curve as Looker's top drawback.

Tableau and Power BI take a more visual approach to data modeling. Tableau uses VizQL to translate drag-and-drop interactions into optimized queries, while Power BI relies on DAX expressions and a tabular model within Microsoft Fabric. Neither requires a separate semantic layer to get started, though both now support optional semantic modeling for governance at scale. This means analysts can connect to data and produce visualizations immediately rather than waiting for a modeling layer to be built.

ThoughtSpot's architecture inverts the traditional BI workflow entirely. Instead of analysts building dashboards that business users consume passively, ThoughtSpot connects directly to cloud data warehouses like Snowflake, BigQuery, Databricks, and Redshift to execute live queries in response to natural language questions. Its Spotter 3 agent performs multi-step analyses autonomously, surfacing trends and anomalies without human prompting. Qlik Sense's Associative Engine loads data into memory and indexes all field relationships, enabling exploration patterns that SQL-based tools cannot replicate.

Mode and Sisense occupy distinct niches. Mode operates as a lightweight notebook-style environment where SQL is the primary interface, making it ideal for analyst-heavy teams that value code transparency over visual dashboards. Sisense's architecture is optimized for embedding, with robust multi-tenancy, white-labeling, and API-driven customization that suits SaaS providers building analytics into their products.

Pricing Comparison

Pricing varies dramatically across these platforms, both in model and total cost of ownership.

PlatformEntry PriceMid-TierEnterpriseModel
LookerAnnual commitment, customCustom quoteCustom quotePer-seat + usage
TableauViewer: $15/user/moExplorer: $42/user/moCreator: $75/user/moPer-seat, role-based
Power BIFree (individual)Pro: $14/user/moPremium: $24/user/moPer-seat, freemium
ThoughtSpotEssentials: $25/user/moPro: $50/user/moCustomPer-seat + consumption
SisenseCustom enterpriseCustom enterpriseCustom enterpriseCustom, row-based tiers
Qlik SenseCustom enterpriseCustom enterpriseCustom enterprisePer-seat, enterprise
Mode AnalyticsCustom enterpriseCustom enterpriseCustom enterprisePer-seat, enterprise

Power BI is the clear winner on per-user cost, but that comparison requires context: Power BI Pro at $14/user/month assumes your organization already pays for Microsoft 365 licensing. Tableau's role-based pricing creates transparency but costs add up quickly -- a team of 5 Creators, 15 Explorers, and 50 Viewers costs approximately $21,060/year in license fees alone on Standard Cloud. ThoughtSpot's Essentials plan at $25/user/month is competitive for smaller teams, but the Pro plan at $50/user/month and consumption-based query pricing can push costs higher as usage scales. Looker requires annual commitments with custom quotes through Google Cloud sales, making it one of the harder platforms to budget for upfront.

When to Consider Switching

The most common trigger for leaving Looker is the LookML bottleneck. When business users cannot get answers without filing requests to the data team for model changes, self-service analytics breaks down. Looker users frequently report that the platform is "not intuitive" and that it "takes some time" to get productive. If your organization values analyst independence over centralized governance, Tableau, ThoughtSpot, or Power BI will feel dramatically more responsive.

Cost structure is the second major driver. Looker's opaque, sales-driven pricing makes budgeting difficult, and organizations often discover at renewal that costs have grown substantially. Power BI's transparent per-user pricing or ThoughtSpot's published tier structure give finance teams the predictability they need.

Ecosystem lock-in matters too. Looker is increasingly tied to Google Cloud and BigQuery. If your data infrastructure runs on Azure, Power BI's native integration with Microsoft Fabric, Synapse, and the extensive Azure ecosystem eliminates friction that Looker would introduce. Similarly, organizations invested in Salesforce may find Tableau's deepening CRM integration more valuable than Looker's Google-centric approach.

Finally, consider switching if your primary need has shifted toward embedded analytics. While Looker offers embedded capabilities through its API, Sisense and ThoughtSpot have purpose-built their platforms around embedding use cases with more flexible multi-tenancy and white-labeling options.

Migration Considerations

Migrating away from Looker means confronting the LookML investment head-on. Every metric definition, dimension, explore, join, and derived table built in LookML needs to be recreated in the target platform's modeling layer. There is no automated converter between LookML and Tableau's data modeling, Power BI's DAX semantic models, or ThoughtSpot's semantic layer. Plan for your data team to manually rebuild the semantic layer, prioritizing the most-used explores and dashboards first.

User retraining is the second major cost. Looker users accustomed to explores and the specific Looker workflow will need structured onboarding on the new platform. Tableau and Power BI both have extensive free training resources and certification programs, which helps reduce this burden. ThoughtSpot's natural language interface typically requires the least formal training since business users can simply type questions.

Data pipeline compatibility should be validated early. If your ETL/ELT pipelines write to BigQuery and you are moving to a non-Google BI tool, confirm that the new platform connects reliably to your warehouse. Looker's Persistent Derived Tables (PDTs) will need equivalent materialization in the target platform or in your warehouse's transformation layer using tools like dbt. Most modern BI tools support BigQuery, Snowflake, Redshift, and Databricks, but connection performance and feature support vary by platform.

We recommend a phased migration: run both platforms in parallel for the first phase, migrating department by department. Start with a team whose dashboards are relatively self-contained, validate accuracy against Looker's outputs, then expand. User permissions and row-level security require careful mapping -- Looker's access filters must be translated to the target platform's security model, whether that is Power BI's DAX-based row-level security, Tableau's user filters, or ThoughtSpot's native row-level security.

What users say about Looker

Historical review enrichment from TrustRadius.

Pros

  • Easy to learn
  • Drag and drop
  • Chat support

Cons

  • Takes some time
  • Slow at times
  • Long to load
  • Documentation available

Public signals

About these signals

Verified factual signals from public sources. They indicate observable activity or interest, not total adoption, product quality, or cost.

2.0M PyPI weekly downloads104.6k npm weekly downloads0 vulnerabilities across 2 packages

See all signals from 7 sources
Source
Signals
Last updated
PyPI
Weekly downloads:2.0M↑4.1k
September 21, 2026
npm
Weekly downloads:104.6k↑50.3k
September 21, 2026
Google Trends
Search interest:Top 31%overallTop 21%in Business Intelligence
September 21, 2026
Hacker News
Matching stories, 90d:2
September 21, 2026
Product Hunt
Comments:5Reviews:0Votes:83
September 21, 2026
Stack Overflow
Questions:226
September 21, 2026
OSV
Package vulnerabilities:0 vulnerabilitiesacross 2 packages

npm · @looker/sdk@26.12.0 · PyPI · looker-sdk@26.12.0

September 21, 2026

Discussed on Hacker News

Recent Hacker News threads mentioning Looker.

Looker product dashboard and interface

Related BI Platforms

Other BI platforms in the catalog. Same kind of product, not a substitution recommendation.