Decision comparison
Mode Analytics vs Tableau
Mode Analytics and Tableau serve different segments of the business intelligence market. Mode is purpose-built for data teams who think in SQL, Python, and R and want a unified platform that bridges ad hoc analysis with self-service reporting. Tableau is a broad enterprise play, offering extensive visualization depth, a sizable user community, and a product portfolio that spans from desktop authoring to agentic AI. The right choice depends on whether your priority is empowering a data team or equipping an entire organization.
Direct comparison. These are reviewed substitutes bought for the same job, so the differences below are the ones that decide between them.
All 2 are BI platforms.
Quick Comparison
| Decision factor | Mode Analytics | Tableau |
|---|---|---|
| Best For | Data teams combining SQL, Python, and R with visual analytics | Organizations needing enterprise-grade visual analytics at scale |
| Pricing Model | Contact for pricing | Tableau Cloud Standard Edition: Viewer $15/user/month, Explorer $42/user/month, Creator $75/user/month; Enterprise Edition: Viewer $35/user/month, Explorer $70/user/month, Creator $115/user/month; Tableau+ Bundle requires contact sales for pricing details. |
| Learning Curve | Moderate — analysts familiar with SQL and notebooks adapt quickly | Steeper — powerful but requires dedicated training investment |
| Data Team Focus | Built specifically for data teams with integrated SQL, Python, and R notebooks | Serves entire organization from analysts (Creator) to executives (Viewer) |
| Deployment Options | Cloud-hosted SaaS platform | Cloud (Tableau Cloud), self-hosted (Tableau Server), or desktop |
| Visualization Depth | Strong visual exploration with drag-and-drop plus notebook-driven advanced analytics | Industry-leading visualization engine with extensive chart types and interactivity |
Mode Analytics
- Best For:
- Data teams combining SQL, Python, and R with visual analytics
- Pricing Model:
- Contact for pricing
- Learning Curve:
- Moderate — analysts familiar with SQL and notebooks adapt quickly
- Data Team Focus:
- Built specifically for data teams with integrated SQL, Python, and R notebooks
- Deployment Options:
- Cloud-hosted SaaS platform
- Visualization Depth:
- Strong visual exploration with drag-and-drop plus notebook-driven advanced analytics
Tableau
- Best For:
- Organizations needing enterprise-grade visual analytics at scale
- Pricing Model:
- Tableau Cloud Standard Edition: Viewer $15/user/month, Explorer $42/user/month, Creator $75/user/month; Enterprise Edition: Viewer $35/user/month, Explorer $70/user/month, Creator $115/user/month; Tableau+ Bundle requires contact sales for pricing details.
- Learning Curve:
- Steeper — powerful but requires dedicated training investment
- Data Team Focus:
- Serves entire organization from analysts (Creator) to executives (Viewer)
- Deployment Options:
- Cloud (Tableau Cloud), self-hosted (Tableau Server), or desktop
- Visualization Depth:
- Industry-leading visualization engine with extensive chart types and interactivity
Public signals
Verified factual signals only. Bars appear only for like-for-like metrics with five weekly assessments for every tool; missing evidence stays explicit. These signals do not establish enterprise adoption, product quality, or total cost.
| Metric | Mode Analytics | Tableau |
|---|---|---|
| Search interest(Market interest) | 1 | 85 |
| Hacker News mentions, 90d(Community interest) | 1 | 2 |
| Product Hunt comments(Community interest) | 9 | 3 |
| Product Hunt rating(Community interest) | Unavailable | 4.2/5 |
| Product Hunt reviews(Community interest) | 0 | 5 |
| Product Hunt votes(Community interest) | 105 | 7 |
| Stack Overflow questions(Community interest) | 14 | 5.4k |
| GitHub commits, 90d(Developer adoption) | Not available | 37 |
| GitHub stars(Developer adoption) | Not available | 716 |
| npm weekly downloads(Developer adoption) | Not available | 32.2k |
| PyPI weekly downloads(Developer adoption) | Not available | 965.7k |
As of September 21, 2026 — updated weekly.
Health & risk evidence
Observed public-source checks for mapped package versions and repositories.
Mode Analytics
Package vulnerabilities
Not available
Repository security score
Not available
Tableau
September 21, 2026Package vulnerabilities
npm · @tableau/embedding-api@3.16.1 · PyPI · tableauserverclient@0.41
0 vulnerabilities
across 2 packages
Repository security score
github.com/tableau/server-client-python
5.5/10
Interface Preview
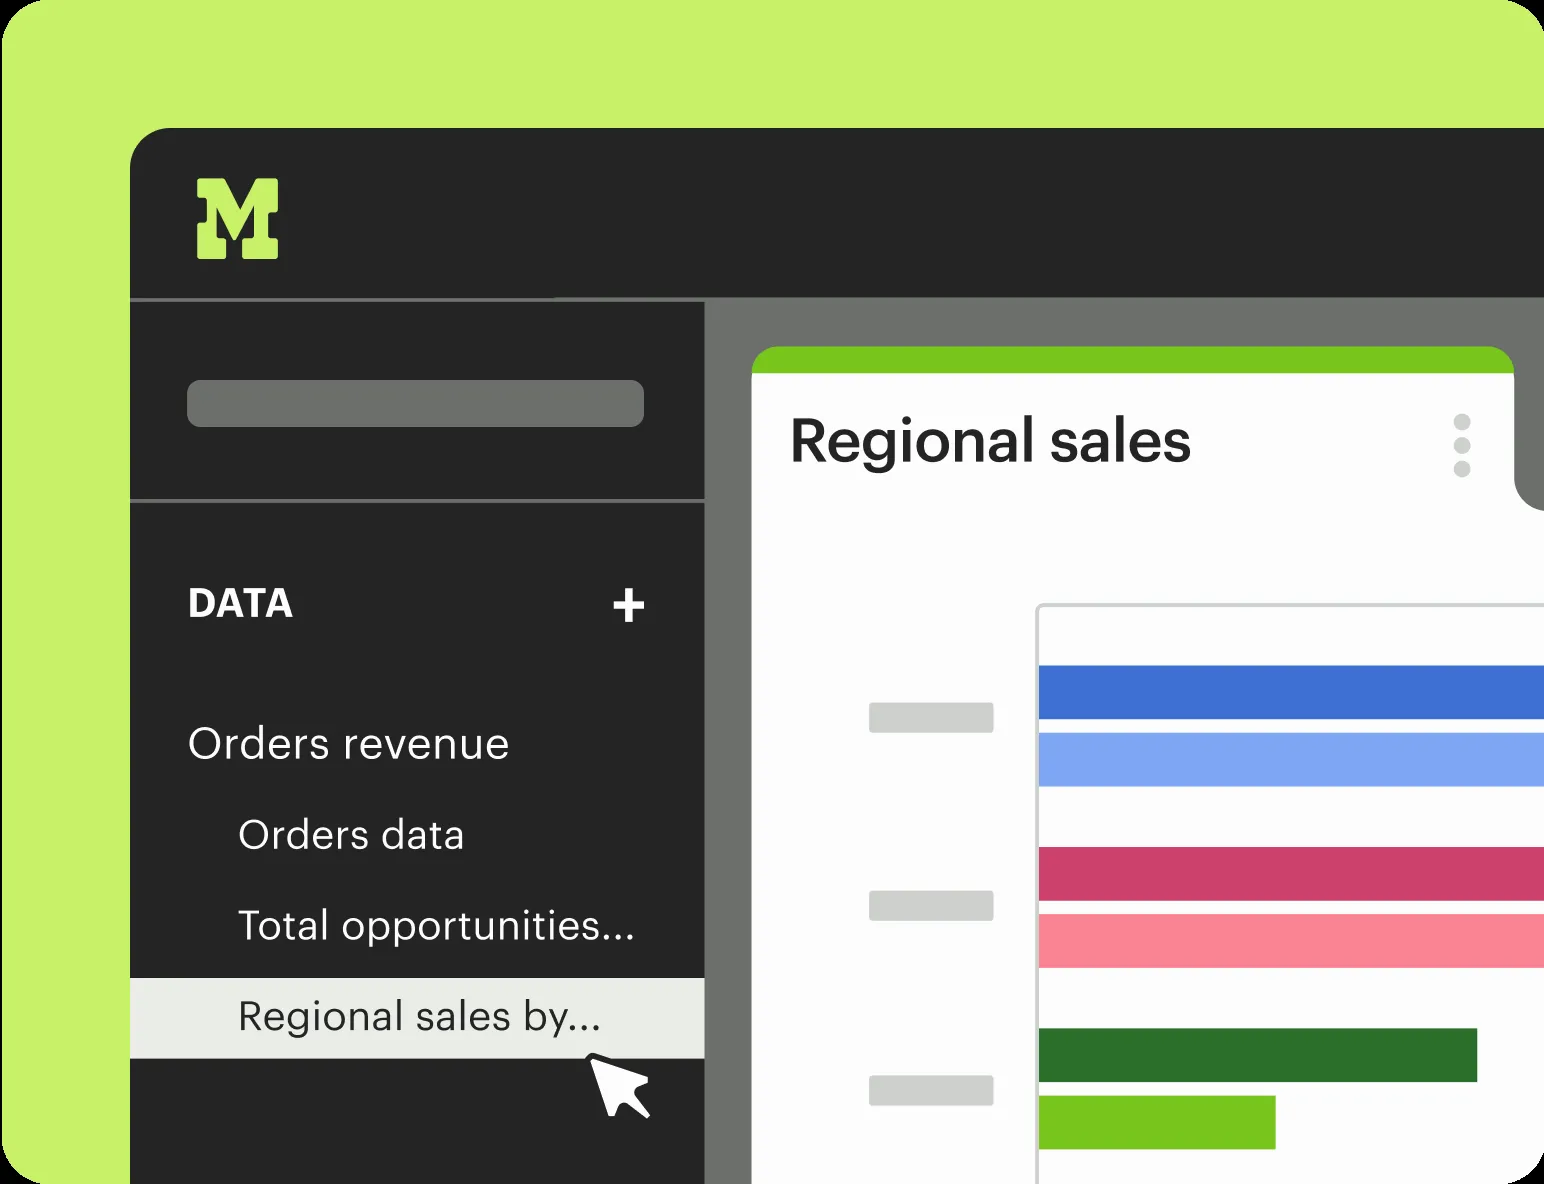
Mode Analytics
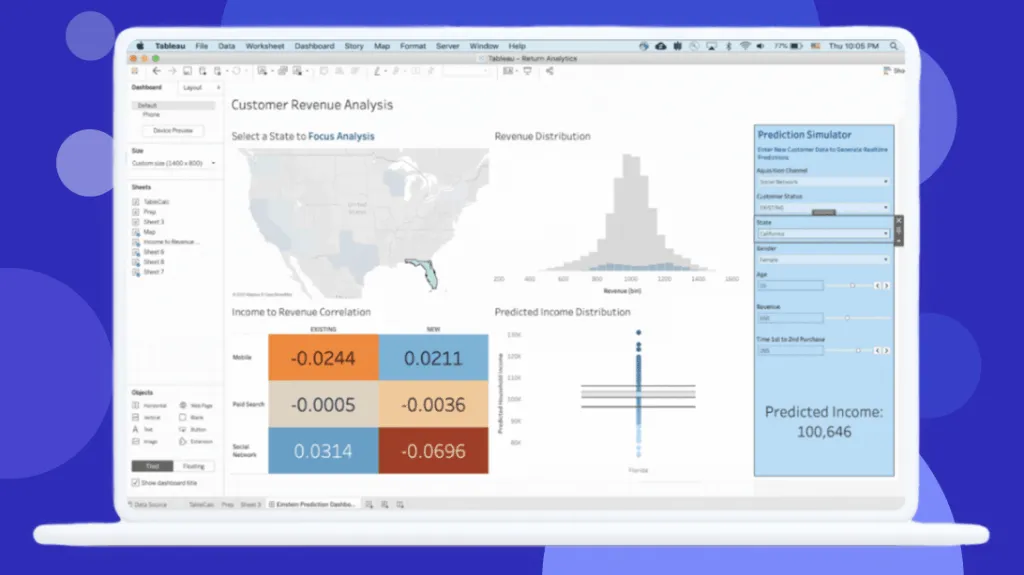
Tableau
Feature Comparison
| Feature | Mode Analytics | Tableau |
|---|---|---|
| Core Analytics | ||
| SQL Editor | Built-in SQL editor with rapid query iteration | Limited — relies on visual query builder and calculated fields |
| Python & R Notebooks | Integrated notebooks that load SQL results directly | TabPy and RServe extensions available but not natively integrated |
| Drag-and-Drop Exploration | Visual exploration of 100K+ datapoints in browser | Industry-leading drag-and-drop interface with deep drill-down |
| Reporting & Dashboards | ||
| Interactive Dashboards | Dashboards anyone can explore with follow-up questions | Advanced interactive dashboards with filtering, parameters, and actions |
| Self-Service Reporting | Curated datasets power team explorations without tickets | Explorer and Viewer roles enable governed self-service access |
| Scheduled Reports | Scheduled report runs with automatic email and Slack updates | Scheduled extracts and subscriptions (10 refreshes/day on standard Cloud) |
| Data Management | ||
| Reusable Datasets | Build and maintain curated datasets for all teams | Published data sources with governance controls |
| Semantic Layer | dbt Semantic Layer integration for governed metrics | Tableau Semantics — AI-infused semantic layer with Data 360 |
| Data Preparation | SQL-based preparation within the analysis workflow | Tableau Prep Builder included with Creator license |
| Collaboration & Sharing | ||
| Embedded Analytics | Embed reports in internal tools via APIs | Enterprise-grade embedding with additional licensing |
| Programmatic APIs | Full programmatic API access for automation | API-first architecture with composable design in Tableau Next |
| Slack Integration | Automatic Slack updates for scheduled reports | Permission-aware analytics directly in Slack channels |
| Enterprise & AI | ||
| Agentic AI | Not verified | Agentforce integration for autonomous analytics actions |
| Custom Data Apps | Build internal tools with HTML, CSS, JavaScript, and APIs | Dashboard extensions and embedded analytics |
| Access Controls | Granular access controls with identity management and provisioning | Role-based licensing (Creator, Explorer, Viewer) with enterprise security |
Core Analytics
SQL Editor
Python & R Notebooks
Drag-and-Drop Exploration
Reporting & Dashboards
Interactive Dashboards
Self-Service Reporting
Scheduled Reports
Data Management
Reusable Datasets
Semantic Layer
Data Preparation
Collaboration & Sharing
Embedded Analytics
Programmatic APIs
Slack Integration
Enterprise & AI
Agentic AI
Custom Data Apps
Access Controls
Which to choose
Mode Analytics and Tableau serve different segments of the business intelligence market. Mode is purpose-built for data teams who think in SQL, Python, and R and want a unified platform that bridges ad hoc analysis with self-service reporting. Tableau is a broad enterprise play, offering extensive visualization depth, a sizable user community, and a product portfolio that spans from desktop authoring to agentic AI. The right choice depends on whether your priority is empowering a data team or equipping an entire organization.
Best-fit scenarios
Choose Mode Analytics if:
We recommend Mode Analytics for data-team-centric organizations where analysts drive decisions through SQL, Python, and R workflows. Mode shines when your data team needs a single platform to perform ad hoc analysis, build reusable datasets, and deliver self-service reporting without lengthy implementation cycles. Teams already invested in the modern data stack with dbt, cloud warehouses, and notebook-driven workflows will find Mode fits naturally into their existing processes. The platform gets teams productive in under 30 minutes, and the combination of SQL editing, notebook integration, and visual exploration in one environment eliminates the context-switching that slows down analysis. If your organization values speed-to-insight for a focused data team over broad enterprise rollout, Mode is the stronger choice.
Choose Tableau if:
We recommend Tableau for organizations that need enterprise-scale visual analytics serving hundreds or thousands of users across departments. Tableau is the right pick when you have diverse user personas — from power analysts who build complex dashboards to executives who only consume reports — because the Creator, Explorer, and Viewer licensing model lets you match cost to usage. The visualization engine remains the industry benchmark, and the Salesforce ecosystem integration adds CRM analytics and agentic AI capabilities through Agentforce. Be prepared for significant investment: Tableau Cloud Standard Edition starts at $15 per user per month for Viewers, $42 for Explorers, and $75 for Creators, all billed annually. Enterprise Edition pricing runs higher at $35, $70, and $115 per user per month respectively. Budget for analyst training and consider Enterprise edition pricing from the start if you need advanced security, data management, or embedded analytics capabilities.
These scenarios reflect the available product evidence. Your requirements, existing stack, and team expertise should guide the final decision.
Frequently Asked Questions
Can Mode Analytics replace Tableau for enterprise reporting?
Mode Analytics and Tableau serve different primary audiences. Mode excels at empowering data teams with SQL, Python, and R in a unified environment, making it ideal for ad hoc analysis and analyst-driven reporting. Tableau is built for enterprise-wide deployment with role-based licensing that serves everyone from data creators to dashboard viewers. If your reporting needs center on a data team producing insights, Mode can handle the job. If you need thousands of business users consuming and interacting with dashboards independently, Tableau's broader user model is better suited.
How do Mode Analytics and Tableau compare on pricing?
Mode Analytics uses an enterprise pricing model that requires contacting their sales team for a quote. Tableau publishes transparent per-user pricing: Viewer at $15 per user per month, Explorer at $42, and Creator at $75, all billed annually on the Standard Edition. Tableau also offers an Enterprise edition at higher rates — Viewer $35, Explorer $70, Creator $115 per user per month. Mode's pricing is not publicly disclosed, so direct cost comparison requires obtaining quotes from both vendors based on your specific team size and needs.
Which platform is better for teams that use SQL and Python heavily?
Mode Analytics has a clear advantage for SQL-and-Python-heavy teams. Mode provides a built-in SQL editor for rapid query iteration, and SQL results load directly into integrated Python and R notebooks for advanced analytics. This tight integration means analysts stay in one environment from data exploration through statistical modeling to visualization. Tableau supports Python through TabPy extensions and R through RServe, but these are add-ons rather than core features. For teams whose primary workflow is writing SQL queries and then analyzing results with Python, Mode provides a more seamless experience.
What are the main limitations of each platform?
Mode Analytics has a focused user community compared to Tableau, which means a limited number of third-party resources, templates, and community-built solutions. Mode also lacks the agentic AI capabilities that Tableau is building through Agentforce. Its enterprise pricing model requires a sales conversation, making it harder to evaluate costs upfront. Tableau's limitations include a steeper learning curve that typically requires formal training investment. Tableau's per-user costs scale quickly for large organizations, and the platform requires clean, well-structured data — teams often report spending significant time on data preparation before Tableau can use their data effectively.