Decision comparison
Power BI vs Sisense
Power BI and Sisense aim at different audiences. Power BI is built for distributing analytics inside an organisation, with semantic models, DAX, deep Excel and Teams integration, Entra identity and per-user or capacity licensing. Sisense is built for embedding analytics into a product for external users, with an in-memory engine, a developer SDK and white-labelling.
Architecture choice. These take different approaches to the same problem. Read the table as a fit question rather than a feature race.
All 2 are BI platforms.
Quick Comparison
| Decision factor | Power BI | Sisense |
|---|---|---|
| What it is | Microsoft's BI platform, with semantic models, DAX, Excel integration and per-user or capacity licensing | A BI and embedded analytics platform built around its own in-memory analytical engine and a developer SDK for embedding |
| Primary audience | Internal business users across an organisation, especially where Microsoft 365 is standard | Product teams embedding analytics for customers, and organisations wanting a built-in engine |
| Licensing | Per user for Pro and Premium Per User, or Fabric capacity for wider distribution | Capacity and deployment based, aimed at serving many viewers including external ones |
| Modelling | Semantic models with DAX, import mode or DirectQuery against the warehouse | Modelled data held in its in-memory engine, or live queries against the warehouse |
| Embedding | Power BI Embedded for putting reports in applications, with capacity-based pricing | Developer SDK and white-labelling built around embedding as the main use case |
| Ecosystem | Entra identity, Excel, Teams, Azure and Microsoft Fabric | Warehouses, databases and its own engine, with integration through APIs |
| Best fit | Organisations on Microsoft 365 distributing dashboards internally | Software vendors and teams shipping analytics inside their own product |
Power BI
- What it is:
- Microsoft's BI platform, with semantic models, DAX, Excel integration and per-user or capacity licensing
- Primary audience:
- Internal business users across an organisation, especially where Microsoft 365 is standard
- Licensing:
- Per user for Pro and Premium Per User, or Fabric capacity for wider distribution
- Modelling:
- Semantic models with DAX, import mode or DirectQuery against the warehouse
- Embedding:
- Power BI Embedded for putting reports in applications, with capacity-based pricing
- Ecosystem:
- Entra identity, Excel, Teams, Azure and Microsoft Fabric
- Best fit:
- Organisations on Microsoft 365 distributing dashboards internally
Sisense
- What it is:
- A BI and embedded analytics platform built around its own in-memory analytical engine and a developer SDK for embedding
- Primary audience:
- Product teams embedding analytics for customers, and organisations wanting a built-in engine
- Licensing:
- Capacity and deployment based, aimed at serving many viewers including external ones
- Modelling:
- Modelled data held in its in-memory engine, or live queries against the warehouse
- Embedding:
- Developer SDK and white-labelling built around embedding as the main use case
- Ecosystem:
- Warehouses, databases and its own engine, with integration through APIs
- Best fit:
- Software vendors and teams shipping analytics inside their own product
Public signals
Verified factual signals only. Bars appear only for like-for-like metrics with five weekly assessments for every tool; missing evidence stays explicit. These signals do not establish enterprise adoption, product quality, or total cost.
| Metric | Power BI | Sisense |
|---|---|---|
| GitHub commits, 90d(Developer adoption) | 0 | 9 |
| GitHub stars(Developer adoption) | 1,000+ | 38 |
| Search interest(Market interest) | 62 | 0 |
| Hacker News mentions, 90d(Community interest) | 0 | 0 |
| npm weekly downloads(Developer adoption) | 241.2k | 2.1k |
| Product Hunt comments(Community interest) | 0 | 2 |
| Product Hunt reviews(Community interest) | 0 | 0 |
| Product Hunt votes(Community interest) | 2 | 130 |
| Stack Overflow questions(Community interest) | 20.5k | 30 |
| PyPI weekly downloads(Developer adoption) | Not available | 202 |
As of September 21, 2026 — updated weekly.
Health & risk evidence
Observed public-source checks for mapped package versions and repositories.
Power BI
September 21, 2026Package vulnerabilities
npm · powerbi-client@2.24.1
0 vulnerabilities
across 1 package
Repository security score
github.com/microsoft/PowerBI-JavaScript
7.4/10
Sisense
September 21, 2026Package vulnerabilities
npm · @sisense/sdk-ui@2.36.0 · PyPI · pysisense@2.1.0
0 vulnerabilities
across 2 packages
Repository security score
Not available
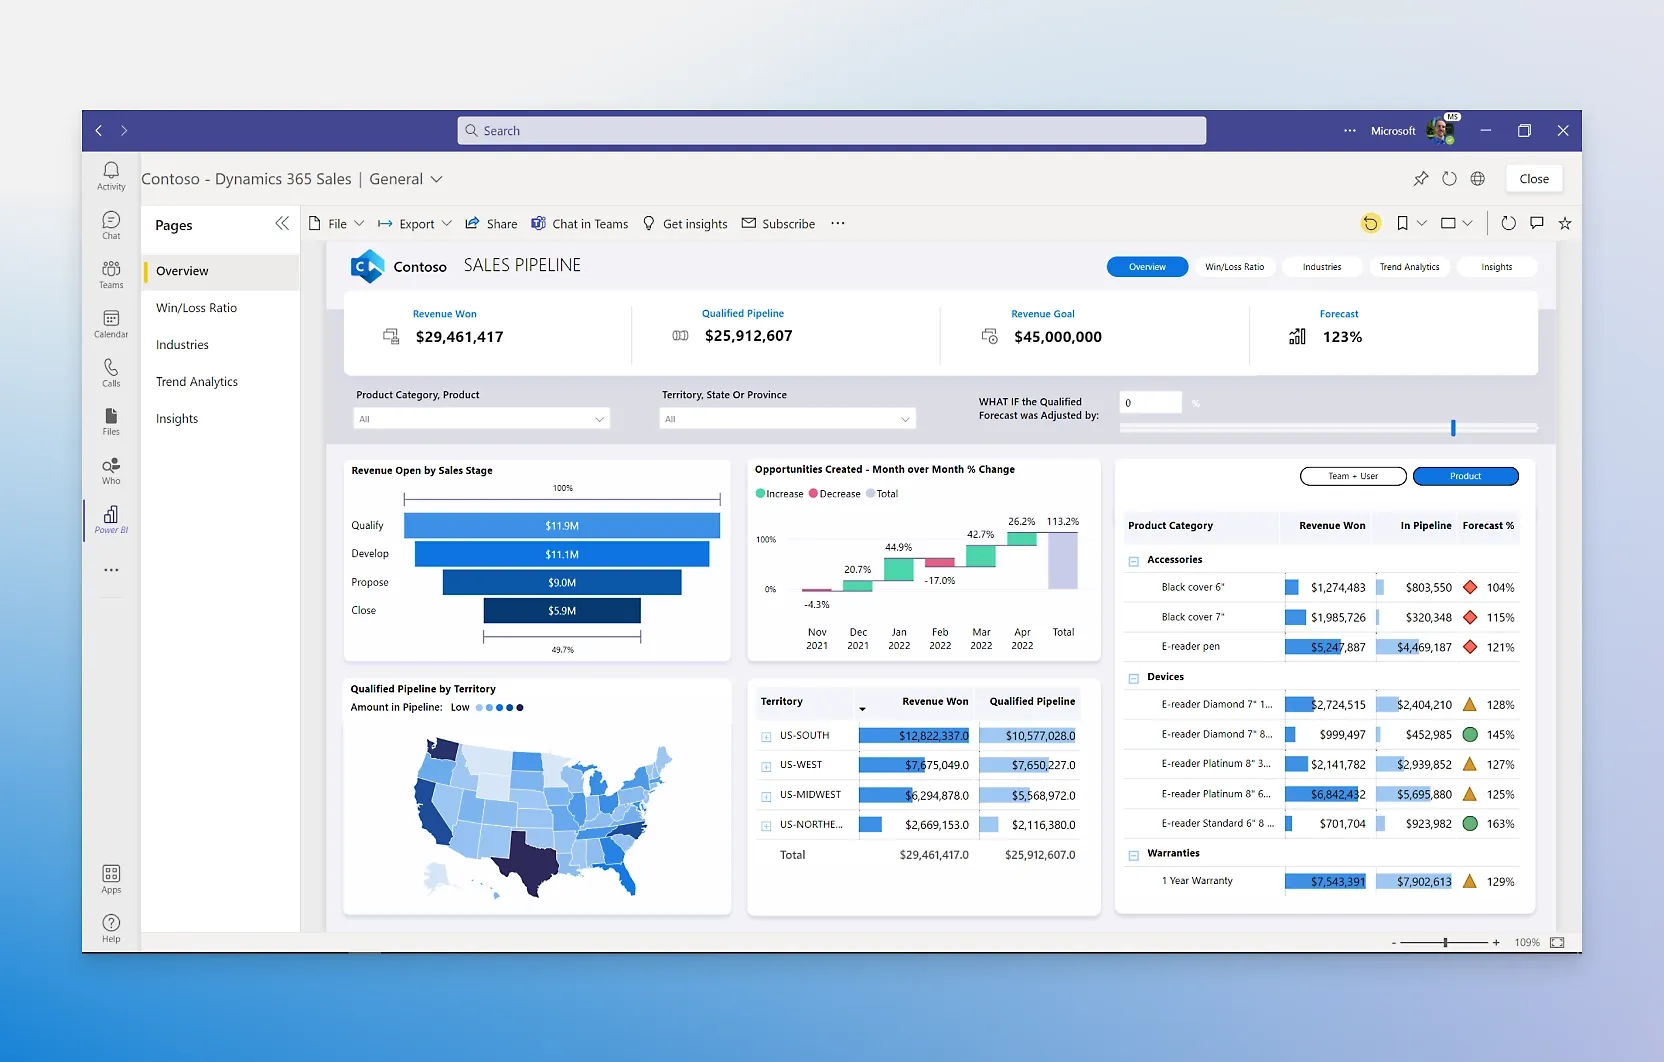
Interface Preview
Power BI
Sisense

Feature Comparison
| Feature | Power BI | Sisense |
|---|---|---|
| Modelling | ||
| Semantic model layer | Full support | Partial support |
| Own in-memory analytical engine | Full support | Full support |
| Live warehouse querying | Full support | Full support |
| Metrics reused across reports | Full support | Partial support |
| Delivery | ||
| Interactive dashboards | Full support | Full support |
| Embedding in your own application | Full support | Full support |
| White-labelling for external customers | Partial support | Full support |
| Scheduled reports and alerts | Full support | Full support |
| Ecosystem | ||
| Microsoft 365 and Excel integration | Full support | Partial support |
| Native cloud identity integration | Full support | Partial support |
| Run in your own infrastructure | Partial support | Full support |
| REST API for automation | Full support | Full support |
| Analysis | ||
| Self-service exploration | Full support | Full support |
| Natural language querying | Full support | Full support |
| Machine learning features | Full support | Full support |
| Multi-tenant customer deployments | Partial support | Full support |
Modelling
Semantic model layer
Own in-memory analytical engine
Live warehouse querying
Metrics reused across reports
Delivery
Interactive dashboards
Embedding in your own application
White-labelling for external customers
Scheduled reports and alerts
Ecosystem
Microsoft 365 and Excel integration
Native cloud identity integration
Run in your own infrastructure
REST API for automation
Analysis
Self-service exploration
Natural language querying
Machine learning features
Multi-tenant customer deployments
Which approach fits
Power BI and Sisense aim at different audiences. Power BI is built for distributing analytics inside an organisation, with semantic models, DAX, deep Excel and Teams integration, Entra identity and per-user or capacity licensing. Sisense is built for embedding analytics into a product for external users, with an in-memory engine, a developer SDK and white-labelling.
When each approach fits
Choose Power BI if:
Choose Power BI when the audience is your own organisation and Microsoft 365 is already standard. Reports appear in Teams, models connect to Excel where analysts already work, Entra handles identity, and semantic models keep definitions consistent across reports. Fabric capacity licensing covers distribution to large internal audiences.
Choose Sisense if:
Choose Sisense when analytics ship inside your product for customers who will never see your BI tool. The developer SDK, white-labelling and multi-tenant deployment are built for that, and the in-memory engine keeps interactive dashboards responsive for many concurrent users without a warehouse query behind every click.
These scenarios reflect the available product evidence. Your requirements, existing stack, and team expertise should guide the final decision.
Frequently Asked Questions
Can Power BI embed into our product?
Yes, through Power BI Embedded, and plenty of software vendors do it. The considerations are capacity pricing as your customer base grows, how much Microsoft branding and interface behaviour you can change, and how tenant isolation is managed for external customers. Sisense is designed around that case rather than accommodating it, which shows most in white-labelling and multi-tenant management.
How many times will we define a metric?
Once per platform if the semantic layer is central, and once per dashboard if it is not. This is the difference that shows up two years in, when revenue is calculated three different ways across 40 dashboards and nobody can say which is right. Ask each vendor to show where a metric definition lives, and whether the same definition serves dashboards, embedded applications, exports and any API consumer.
How much does Excel integration matter?
More than most comparisons admit. In many organisations the real analytical work happens in Excel, and a BI platform whose models connect directly to it meets analysts where they are rather than asking them to move. If your finance and operations teams live in spreadsheets, that integration removes friction no dashboard feature replaces. If they do not, it is a feature you will not use.
Which handles many concurrent viewers?
Both can, by different routes. Power BI uses import mode with its in-memory engine plus capacity licensing sized for the audience, so heavy internal distribution is a capacity planning exercise. Sisense models data into its engine and is sized around serving embedded viewers, including external ones. For thousands of external customers, check the licensing model carefully on both, because that is where the cost appears.
What about running on our own infrastructure?
Sisense can be self-managed, which matters when a customer contract or a residency rule requires analytics to run in a specific place. Power BI is a cloud service; the on-premises data gateway lets it query data that stays in your network, but the platform itself is Microsoft-operated. If the requirement is that the whole stack runs under your control, that difference decides it.
Are the analysis features comparable?
Broadly, yes. Self-service exploration, natural language querying and machine-learning-assisted analysis exist on both, and both are capable for standard business reporting. Differences at that level rarely decide a platform choice; audience and deployment model almost always do, which is why those are worth settling first.