Decision comparison
Sigma Computing vs Spotfire
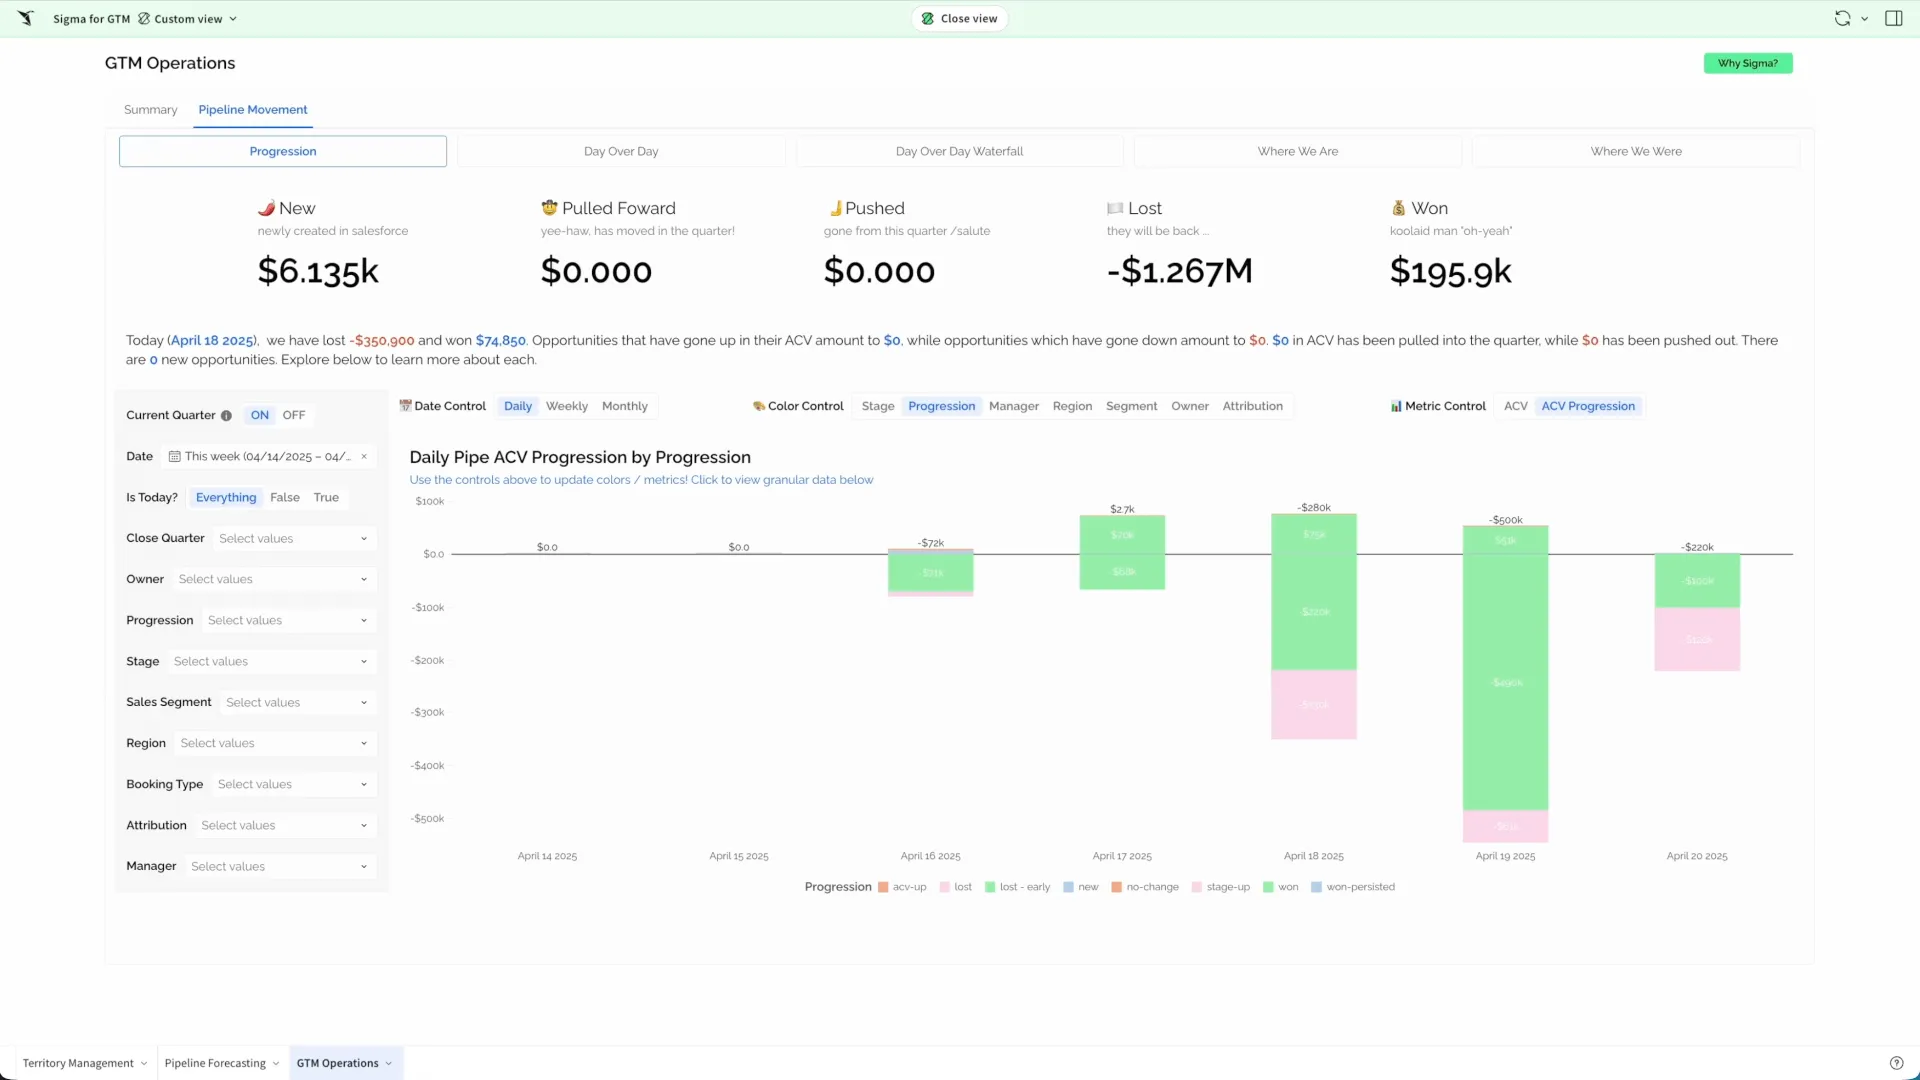
Sigma and Spotfire both serve analysts and hand them different tools. Sigma is a spreadsheet grid over the warehouse: familiar rows, columns and formulas, with every action compiled to SQL so nothing is copied. Spotfire is a visual canvas: linked charts, drill paths and R or Python for statistical work.
Direct comparison. These are reviewed substitutes bought for the same job, so the differences below are the ones that decide between them.
All 2 are BI platforms.
Quick Comparison
| Decision factor | Sigma Computing | Spotfire |
|---|---|---|
| What it is | A spreadsheet-native interface over the warehouse, where analysts work in familiar rows and columns and every action becomes SQL | An analytics platform built around interactive visual exploration, with R and Python available beside the charts |
| Interface | A spreadsheet grid with formulas, pivots and calculated columns | A visual canvas with linked charts and drill paths |
| Primary user | Analysts and business users who already work in spreadsheets | Analysts who think visually and need statistical depth |
| Advanced analytics | SQL and spreadsheet functions, with modelling pushed to the warehouse | R and Python beside the visualisations |
| Query pattern | Live SQL against the warehouse; no extract to refresh | Live querying or in-memory extracts, depending on the source |
| Deployment | Cloud service over your warehouse | Cloud or on-premise, depending on licensing |
| Best fit | Organisations whose users export to spreadsheets to do real work | Teams whose exploration is visual and statistical |
| Connectivity | Connects to Snowflake, BigQuery, Redshift and Databricks over standard drivers, with REST APIs for automation | Connects to Snowflake, BigQuery, Redshift and Databricks over standard drivers, with REST APIs for automation |
Sigma Computing
- What it is:
- A spreadsheet-native interface over the warehouse, where analysts work in familiar rows and columns and every action becomes SQL
- Interface:
- A spreadsheet grid with formulas, pivots and calculated columns
- Primary user:
- Analysts and business users who already work in spreadsheets
- Advanced analytics:
- SQL and spreadsheet functions, with modelling pushed to the warehouse
- Query pattern:
- Live SQL against the warehouse; no extract to refresh
- Deployment:
- Cloud service over your warehouse
- Best fit:
- Organisations whose users export to spreadsheets to do real work
- Connectivity:
- Connects to Snowflake, BigQuery, Redshift and Databricks over standard drivers, with REST APIs for automation
Spotfire
- What it is:
- An analytics platform built around interactive visual exploration, with R and Python available beside the charts
- Interface:
- A visual canvas with linked charts and drill paths
- Primary user:
- Analysts who think visually and need statistical depth
- Advanced analytics:
- R and Python beside the visualisations
- Query pattern:
- Live querying or in-memory extracts, depending on the source
- Deployment:
- Cloud or on-premise, depending on licensing
- Best fit:
- Teams whose exploration is visual and statistical
- Connectivity:
- Connects to Snowflake, BigQuery, Redshift and Databricks over standard drivers, with REST APIs for automation
Public signals
Verified factual signals only. Bars appear only for like-for-like metrics with five weekly assessments for every tool; missing evidence stays explicit. These signals do not establish enterprise adoption, product quality, or total cost.
| Metric | Sigma Computing | Spotfire |
|---|---|---|
| GitHub commits, 90d(Developer adoption) | 0 | 10 |
| GitHub stars(Developer adoption) | 6 | 62 |
| Search interest(Market interest) | 1 | 1 |
| Hacker News mentions, 90d(Community interest) | 0 | 0 |
| npm weekly downloads(Developer adoption) | 16.1k | 22 |
| Product Hunt comments(Community interest) | 1 | Not available |
| Product Hunt reviews(Community interest) | 0 | Not available |
| Product Hunt votes(Community interest) | 6 | Not available |
| PyPI weekly downloads(Developer adoption) | Not available | 1.5k |
| Stack Overflow questions(Community interest) | Not available | 1.6k |
As of September 21, 2026 — updated weekly.
Health & risk evidence
Observed public-source checks for mapped package versions and repositories.
Sigma Computing
September 21, 2026Package vulnerabilities
npm · @sigmacomputing/embed-sdk@0.7.1
0 vulnerabilities
across 1 package
Repository security score
Not available
Spotfire
September 21, 2026Package vulnerabilities
npm · @spotfire/mods-sdk@1.2.0 · PyPI · spotfire@2.4.2
0 vulnerabilities
across 2 packages
Repository security score
Not available
Interface Preview
Sigma Computing
Feature Comparison
| Feature | Sigma Computing | Spotfire |
|---|---|---|
| Interface | ||
| Spreadsheet-style grid and formulas | Full support | Not verified |
| Linked visualisations and drill paths | Partial support | Full support |
| Write-back to the warehouse | Full support | Partial support |
| Ad-hoc exploration | Full support | Full support |
| Analytics | ||
| R and Python integration | Not verified | Full support |
| Statistical and predictive features | Partial support | Full support |
| Calculated columns without SQL | Full support | Partial support |
| Live warehouse querying | Full support | Partial support |
| Operations | ||
| No separate copy to refresh | Full support | Partial support |
| On-premise deployment | Not verified | Full support |
| Embedding in your own application | Full support | Full support |
| Alerting on data changes | Full support | Full support |
| Platform | ||
| Warehouse connectivity | Full support | Full support |
| Scheduled distribution | Full support | Full support |
| Row-level security | Full support | Full support |
| REST API for automation | Full support | Full support |
Interface
Spreadsheet-style grid and formulas
Linked visualisations and drill paths
Write-back to the warehouse
Ad-hoc exploration
Analytics
R and Python integration
Statistical and predictive features
Calculated columns without SQL
Live warehouse querying
Operations
No separate copy to refresh
On-premise deployment
Embedding in your own application
Alerting on data changes
Platform
Warehouse connectivity
Scheduled distribution
Row-level security
REST API for automation
Which to choose
Sigma and Spotfire both serve analysts and hand them different tools. Sigma is a spreadsheet grid over the warehouse: familiar rows, columns and formulas, with every action compiled to SQL so nothing is copied. Spotfire is a visual canvas: linked charts, drill paths and R or Python for statistical work.
Best-fit scenarios
Choose Sigma Computing if:
Choose Sigma when your analysts think in spreadsheets, which most business analysts do. A grid over the warehouse gives them calculated columns, pivots and formulas without copying data out, so their work stays governed and current instead of ending up in a file that disagrees with the source by Friday.
Choose Spotfire if:
Choose Spotfire when the exploration is visual and statistical. Linked visualisations let an analyst brush across charts and follow a lead, drill paths support iteration, and R and Python keep modelling in the same canvas rather than in a separate notebook.
These scenarios reflect the available product evidence. Your requirements, existing stack, and team expertise should guide the final decision.
Frequently Asked Questions
Does a spreadsheet interface mean another copy of the data?
Not in this design — that is the point of it. Actions in the grid compile to SQL that runs against the warehouse, so there is no extract to refresh and nothing to go stale. The trade-off lands on warehouse compute instead: heavy interactive work is heavy querying, which on consumption pricing is a real line item. You are moving the cost, not removing it.
How far can people push a spreadsheet interface?
For pivoting, filtering, adding calculated columns and building on a result, far enough that most exports become unnecessary. For intricate multi-sheet financial models with circular references and bespoke layouts, not far enough, and those users will keep exporting. Look at what people actually do after they export today; that behaviour predicts whether this closes the gap for you.
Which interface do our analysts actually want?
Watch what they do now. If the first move after opening a report is to export it, they want a grid. If they spend their time building charts to see a shape, they want a visual canvas. Both are legitimate ways to think about data and analysts rarely switch willingly, so this is better observed than debated.
Where do metric definitions live in each?
Sigma pushes definitions toward the warehouse by construction — the grid compiles to SQL over your tables — while still letting a workbook define a calculation locally, which is the flexibility people adopt it for and the way two workbooks end up computing margin differently. Its answer is curated datasets and reusable elements. Spotfire is deliberately looser, because exploratory analysis regularly needs a measure that exists only for this investigation. That is correct for analysis and dangerous if those numbers get reported. Keep reported definitions in dbt and leave the workbench free for work that is not standardised.
Does it query the warehouse, or a copy?
Sigma queries live. Grid operations compile to SQL against Snowflake, BigQuery or Databricks, so there is no extract, one copy to govern, and row-level security applied at the source applies everywhere — with the cost landing as warehouse compute. Spotfire commonly works over in-memory data, because iterating on a method against a live connection is painful, and connects live where that is required. The difference follows the work: governed reporting wants the current copy, exploratory analysis wants a stable one to iterate against.
How does licensing behave as the audience grows?
Sigma's per-seat model with a viewer tier grows with headcount, which is forecastable and gets expensive if the intended audience is genuinely everyone. Spotfire's audience does not grow with headcount at all — specialists are a department, not a company — so its licence stays flat while the value concentrates. The planning error is assuming one population. Count the business users who will build and read separately from the analysts who need R and Python, and price each against the product aimed at them.
How should we evaluate them?
Build the same two things on both: the dashboard your executives read every Monday, and the open-ended question an analyst raised last quarter. The first tests modelling, refresh, delivery and governance; the second tests exploration. Most teams find one platform suited to each, which turns an abstract comparison into a decision about which half of the work matters more.