300+ Tools CoveredSource Data Updated Weeklydates

Tool intelligence profile

Sigma Computing

Sigma is the AI analytics workspace for warehouse data. Build governed dashboards, spreadsheets, and workflows with live query, writeback, and collaboration.

Visit Site →
Type
BI Platform
Deployment
Cloud (managed)
Last updatedSeptember 21, 2026

Editor's Take

We recommend Sigma Computing for data teams that want governed, collaborative BI directly on warehouse data, especially where live query, spreadsheet-style analysis, and writeback workflows matter. Its freemium entry point makes it worth piloting against Tableau or Power BI with a 5–10 person analytics team, but the provided context does not establish pricing at scale or prove enterprise adoption, so validate total cost and governance requirements before standardizing.

— Egor Burlakov, Editor

Evaluate Sigma Computing

Popular comparisons

See all 8 Sigma Computing comparisons

Sigma Computing: product and architecture

Our verdict in this Sigma Computing review: Sigma is a strong choice for organizations that already treat the cloud data warehouse as the system of record and want business users to work directly on governed, live data. Its spreadsheet-oriented interface lowers the barrier to analysis without moving data into a separate BI store, but that convenience does not remove the need for disciplined warehouse modeling, access design, and query-cost management. We recommend Sigma for data teams that need a credible bridge between self-service analysis and warehouse-native controls; teams seeking highly specialized visualization design or a simple, low-cost reporting-only tool should look elsewhere.

Overview

Sigma Computing is a cloud-native business intelligence platform positioned as an AI analytics workspace for warehouse data. It combines governed dashboards, spreadsheet-style exploration, workflows, live querying, writeback, and collaboration in one environment. The central architectural choice is important: Sigma queries the cloud warehouse directly rather than relying on a separate extracted data store.

That model makes Sigma most relevant to data engineers, analytics engineers, and data leaders who want reporting and operational analysis to inherit controls from the warehouse. Sigma states that security and governance remain at the source, while its workspace gives users familiar spreadsheet and natural-language interfaces for building governed AI applications. This is a practical proposition for organizations that have invested in a modern warehouse but still field constant requests for spreadsheet exports and ad hoc analysis.

Sigma’s product message is more expansive than traditional dashboarding. It presents an AI Apps platform for discovering insights, building workflows, and taking action on live warehouse data, with a control plane for permissions, audit, and change management. That makes it more ambitious than a visualization layer: the product is intended to support interactive operational work as well as consumption of reports.

There are meaningful adoption signals, though they should not be confused with proof that Sigma fits every enterprise. Sigma says it is trusted by more than 2,000 enterprises worldwide, and its website presents ratings of 4.4 from 500+ reviews and 4.8 from 200+ reviews. Separately, the supplied user-feedback dataset gives Sigma an 8.2/10 rating across 297 reviews. These indicators support the conclusion that the platform has real market usage, but they do not replace a technical evaluation of warehouse compatibility, governance requirements, and reporting needs.

Sigma is best for teams that want governed self-service directly on warehouse data and are prepared to operate it as part of their data platform. Avoid treating it as a replacement for sound semantic definitions, warehouse permissions, or careful ownership of calculated logic. Its strength is that it puts more people closer to live data; its cost is that more people can create complex logic, queries, and permission requirements inside the analytics workspace.

Key Features and Architecture

Sigma’s defining technical feature is its live-query-only design. It runs directly on the warehouse instead of loading data into a separate store, and Sigma explicitly states that it does not use extracts. Teams can control caching and refresh behavior to balance responsiveness with freshness, but the primary data path remains the warehouse rather than a duplicated analytics database.

The zero-copy query model follows from that architecture. Sigma does not require warehouse tables to be duplicated into a separate Sigma-managed store for interactivity, and it can reuse results through cache paths instead of persisting another copy. This reduces data duplication and aligns access with the source, but it also means warehouse query behavior remains a core operational concern for the analytics team.

Its spreadsheet interface is not merely cosmetic. Spreadsheet actions compile into SQL, allowing business users to work in a familiar grid while Sigma generates optimized SQL behind the scenes. For technical users, Sigma exposes the SQL, execution path, and timing details for troubleshooting. That is a useful compromise: analysts can start with a spreadsheet workflow, while data engineers retain a way to inspect what the interface sends to the warehouse.

Governance is enforced at the warehouse boundary at query time. Sigma supports warehouse roles through OAuth or service accounts, then layers platform permissions and audit logs that record changes. This design matters for teams that cannot accept a BI tool becoming an uncontrolled secondary access layer. The trade-off is that access management can become more complex because teams must understand both warehouse-level controls and Sigma platform permissions.

Sigma also provides a unified application workspace for governed AI applications. Users can build applications with spreadsheet and natural-language interfaces, while the platform supplies a control plane for permissions, audit, and change management. The supplied product description also identifies live query, writeback, workflows, collaboration, dashboards, and governed AI apps as part of the workspace. For operational teams, writeback and workflows are the notable extension beyond static BI: the product is designed to help users take action, not only view a metric.

The platform has visible ecosystem validation in the supplied data. Sigma was named Snowflake’s 2025 Business Intelligence Data Cloud Product Partner of the Year, described as its third consecutive year of recognition, and Databricks’s 2025 Business Intelligence Partner of the Year. Sigma is also recognized in the 2025 Gartner Magic Quadrant for Analytics and BI Platforms. These are meaningful signals of vendor relationships and market presence, but they are not substitutes for testing whether Sigma’s worksheet logic, permissions, and warehouse query patterns fit your environment.

Finally, Sigma cites a Forrester Total Economic Impact study finding 321% ROI over three years and payback in under six months. Treat that as vendor-provided economic evidence rather than a universal outcome. The relevant technical question is whether your own organization can translate governed, live warehouse access into fewer manual spreadsheet exports, faster reporting cycles, or more effective operational workflows.

Ideal Use Cases

Sigma is a strong fit for a centralized data team supporting a large population of business users who already work in spreadsheets. Consider a data organization of 8 to 20 data engineers and analytics engineers supporting finance, sales, operations, and product stakeholders. If those teams maintain warehouse tables and need business users to explore live data without learning SQL, Sigma’s spreadsheet actions and generated SQL provide a useful division of labor: stakeholders can investigate, while technical teams can inspect the execution details when performance or logic becomes questionable.

A second strong use case is governed operational analysis where teams need to move from a dashboard to an action. A retail or consumer business managing promotion pricing can use live warehouse data to model scenarios, forecast lift, and act through a governed AI application, which is the specific pricing-and-promotions workflow described in the supplied material. Sigma’s writeback, collaboration, and workflows make it more appropriate here than a tool used solely for viewing reports. The caveat is that operational workflows require careful ownership, auditing, and access design; do not expose writeback broadly before those controls are agreed.

A third use case is a Snowflake- or Databricks-centered enterprise that wants analytics closer to the warehouse. Sigma’s recognition as Snowflake’s 2025 BI Data Cloud Product Partner of the Year and Databricks’s 2025 BI Partner of the Year does not guarantee implementation success, but it makes the platform particularly relevant for evaluation in those ecosystems. Teams operating at enterprise scale can benefit from the zero-copy model and query-time access enforcement when duplicating warehouse data into another platform is undesirable.

Sigma also suits analytics leaders trying to reduce dependence on unmanaged Google Sheets-style processes. User feedback specifically identifies business users, data warehouse access, user friendliness, setup, data visualization, and Google Sheets as strengths. That pattern suggests Sigma can provide a more governed home for familiar spreadsheet behavior, especially when leaders need audit logs and warehouse-enforced access rather than uncontrolled file sharing.

Don’t use Sigma if your primary requirement is highly specialized visualization capabilities or if the team needs an extremely simple reporting layer with minimal governance administration. User-reported weaknesses include visualization capabilities, reports and dashboards, calculated fields, access management, and source code. We would also avoid it when the organization lacks a reliable warehouse and clear ownership of definitions, because Sigma’s value proposition depends on the warehouse being trustworthy enough to query live.

Strengths & Trade-offs

Sigma’s advantages are concrete and closely tied to its warehouse-native architecture, but several user-reported weaknesses deserve serious weight. In our evaluation, the product is strongest when its direct warehouse querying and spreadsheet interface are both requirements, rather than nice-to-have features. Its weaknesses are most visible when a team expects polished visualization specialization or wants permissions and calculated logic to be effortless at scale.

Pros

  • Live warehouse access without extracts: Sigma runs directly on the warehouse and uses a live-query-only model, avoiding a separate extracted data store. This supports fresher analysis and reduces duplicate data handling, though it requires teams to manage warehouse usage thoughtfully.

  • Zero-copy architecture: Sigma does not require copying warehouse tables into a separate store for interactivity. Cached result reuse can improve responsiveness without persisting a separate data copy, which is valuable for teams prioritizing source-level governance.

  • Spreadsheet actions compile into inspectable SQL: Business users can work in a spreadsheet interface while Sigma generates SQL. Technical users can inspect SQL, execution paths, and timing details, which gives analytics engineers a practical route to diagnose expensive or incorrect queries.

  • Warehouse-bound governance: Access is enforced at query time through warehouse roles such as OAuth or service accounts, supplemented by platform permissions and audit logs. This is materially stronger than treating a BI layer as an independent, opaque copy of access policy.

  • Strong usability signal from real users: The supplied 8.2/10 rating from 297 reviews includes strengths such as ease of use, ease of learning, setup, business-user fit, data warehouse access, data visualization, and Google Sheets familiarity. This supports the case for Sigma when adoption by non-SQL users is a central goal.

Cons

  • Calculated fields can become a friction point: Calculated fields are a user-reported weakness. Teams that need deeply standardized metrics should not assume worksheet-level logic will replace disciplined warehouse modeling or a carefully governed definition process.

  • Access management is a real operational burden: Users identify access management as a weakness. Sigma’s warehouse-bound model is valuable, but coordinating warehouse roles, OAuth or service accounts, platform permissions, and audit expectations can be demanding.

  • Visualization capabilities are not its clearest advantage: Real users list visualization capabilities among weaknesses, alongside reports and dashboards. Avoid Sigma if the evaluation is dominated by highly specialized chart design or presentation-first reporting requirements.

  • Screen size and interface complexity matter: Screen size and learning curve appear in user-reported weaknesses. The spreadsheet workspace can be productive, but dense analytical work may be less comfortable for users working on constrained displays or without spreadsheet fluency.

  • Source code and data acquisition concerns remain: Source code and “get data” are also listed as weaknesses in the provided feedback. Teams needing a particular development workflow or frictionless data onboarding should validate those areas directly instead of relying on Sigma’s broader warehouse-native positioning.
Sigma Computing pricing

Starting at
Free tier · paid from $25/mo
Pricing model
Free tier
Free access
Free tier

View full Sigma Computing pricing intelligence →

Alternatives to Sigma Computing

The reviewed substitutes for Sigma Computing among the BI platforms, and what would make each one the better answer.

Direct alternatives

Reviewed substitutes: products bought for the same job, where a team picks one.

Metabase
Choose this if you want fast time-to-value with minimal cost and no mandatory warehouse dependency.Applies to: Choosing between two products of the same kind for one job.
Power BI
Choose this if your organization runs on Microsoft and you need per-user pricing that scales affordably across hundreds of viewers.Applies to: Choosing between these two for the enterprise bi decision.
Looker
Choose this if your priority is a governed semantic layer with Git-based version control and you have data engineers who can maintain LookML models.Applies to: Choosing the BI platform a team will license for dashboards and self-service exploration.
Tableau
Choose this if advanced visualization and a mature ecosystem of connectors and community resources matter to you, alongside live warehouse querying.Applies to: Choosing the BI platform a team will license for dashboards and self-service exploration.
Qlik Sense
Two products of the same kind on one reviewed shortlist, answering the same purchase. 2026 enterprise BI buyer's guides and vendor head-to-heads place these products on one shortlist, and a team adopts one, so the comparison is a substitution.Applies to: Choosing between these two for the enterprise bi decision.
See detailed alternatives analysis

Sigma Computing built its reputation on bringing a spreadsheet-like interface directly on top of cloud data warehouses, letting business users explore billions of rows without writing SQL. But its warehouse-native architecture, pricing structure, and feature set do not fit every team equally. Whether you need a lower-cost entry point, deeper Microsoft integration, open-source flexibility, or a developer-first semantic layer, these Sigma Computing alternatives cover the full range of modern BI needs.

Top Alternatives Overview

Metabase is the strongest open-source alternative to Sigma Computing, with over 46,900 GitHub stars and a self-hosted option that costs nothing. Its visual query builder lets non-technical users create dashboards without SQL, while power users can drop into raw SQL when needed. Metabase Cloud Starter runs $100/month, and the Pro tier at $575/month adds self-hosted deployment, advanced caching, and granular permissions. Where Sigma requires a cloud data warehouse, Metabase connects directly to over 20 data sources including PostgreSQL, MySQL, and MongoDB. Choose this if you want fast time-to-value with minimal cost and no mandatory warehouse dependency.

Power BI offers the most aggressive per-user pricing in the BI market at $14/user/month for Pro and $24/user/month for Premium. Microsoft positioned highest for Ability to Execute in the 2025 Gartner Magic Quadrant for Analytics and BI Platforms. The deep integration with Microsoft 365, Teams, Excel, and Azure makes it the natural choice for organizations already embedded in the Microsoft ecosystem. Power BI uses an import-based data model by default, contrasting with Sigma's live-query approach. Choose this if your organization runs on Microsoft and you need per-user pricing that scales affordably across hundreds of viewers.

Looker takes a code-first approach to BI through LookML, its proprietary semantic modeling language that centralizes business logic in version-controlled definitions. Now part of Google Cloud, Looker integrates tightly with BigQuery and offers embedded analytics via APIs. Standard pricing starts at $99/month with Enterprise on custom pricing. Unlike Sigma's spreadsheet UI, Looker requires data teams to define explores and models before business users can self-serve. Choose this if your priority is a governed semantic layer with Git-based version control and you have data engineers who can maintain LookML models.

Tableau remains the industry standard for visual analytics, with the broadest visualization library in the BI market. Pricing follows a role-based model: Viewer at $15/user/month, Explorer at $42/user/month, and Creator at $75/user/month on the Standard Cloud edition. Tableau's Hyper engine extracts and compresses data for fast in-memory analysis, a fundamentally different approach from Sigma's warehouse-native live queries. For organizations with 50 mixed-license users, annual costs typically range from $40,000 to $100,000. Choose this if advanced visualization and a mature ecosystem of connectors and community resources matter to you, alongside live warehouse querying.

Lightdash is purpose-built for dbt users, making it the best alternative for teams that already define metrics and models in dbt. Its open-source core (5,700+ GitHub stars) supports BI-as-code workflows with version control, CI/CD, and preview environments. Cloud Pro runs $3,000/month with unlimited users and no per-seat pricing. Lightdash queries run through a governed semantic layer inherited from dbt, so metric definitions stay consistent everywhere. Choose this if your data team lives in dbt and wants a BI tool that treats dashboards like code rather than drag-and-drop artifacts.

Amazon QuickSight provides the lowest entry cost among cloud-native BI tools with Standard at $3/user/mo for Readers and $24 for Authors and a no published free tier. Its pay-per-session pricing model means viewer costs scale with actual usage rather than provisioned seats. QuickSight integrates natively with Redshift, Athena, S3, and other AWS services using the SPICE in-memory engine. It lacks the spreadsheet familiarity of Sigma but compensates with tight AWS service integration and ML-powered anomaly detection. Choose this if your data lives primarily in AWS and you want usage-based pricing that keeps costs predictable for organizations with many occasional users.

Architecture and Approach Comparison

Sigma Computing operates as a zero-copy, live-query layer on top of Snowflake, Databricks, BigQuery, and Redshift. Every filter, pivot, and formula compiles into optimized SQL that executes in the warehouse, with a multi-tier caching system that evaluates browser cache, in-browser computation, query ID cache, and warehouse cache before hitting live compute. This architecture means governance stays at the warehouse boundary, and data never leaves its source.

Power BI and Tableau default to importing data into their own engines (VertiPaq and Hyper, respectively), which delivers fast dashboard interactions but creates data copies that can drift from the source. Both support DirectQuery/live connections, but performance typically degrades compared to their import modes. Metabase sits directly on top of your database without ingestion, similar to Sigma's approach but without the warehouse-optimized SQL compilation layer.

Looker and Lightdash both emphasize semantic layers as their core differentiator. Looker uses LookML while Lightdash inherits metric definitions from dbt. Both generate SQL at query time, but neither offers the spreadsheet interaction model that makes Sigma accessible to business users who think in cells and formulas. QuickSight's SPICE engine ingests data for fast performance, positioning it closer to the Tableau/Power BI import model than Sigma's live-query approach.

Pricing Comparison

Sigma's actual costs vary significantly from list prices. Organizations with 50+ users on multi-year terms commonly negotiate 20-35% discounts.

ToolEntry PriceMid-TierEnterprisePricing Model
Sigma Computing$300/mo (Essentials)Custom (Professional)CustomTiered by user role
MetabaseFree (self-hosted)$575/mo (Pro)$20/user/moPer-instance + per-seat
Power BIFree$14/user/mo (Pro)$24/user/mo (Premium)Per-seat
Looker$99/mo (Standard)$299/mo (Premium)CustomPer-seat by role
Tableau$15/user/mo (Viewer)$42/user/mo (Explorer)$75/user/mo (Creator)Per-seat by role
LightdashFree (self-hosted)$3,000/mo (Cloud Pro)CustomFlat rate, unlimited users
Amazon QuickSightFree (5 users)$3/user/mo for Readers and $24 for Authors (Standard)CustomPer-seat or per-session

For a 50-user deployment with mixed roles, Power BI typically costs under $15,000 annually, Tableau runs $40,000-$100,000, and Sigma lands around $60,000-$150,000 according to external benchmarks. Metabase self-hosted eliminates licensing costs entirely, though you carry the infrastructure and maintenance burden.

When to Consider Switching

Switch to Power BI when your organization already pays for Microsoft 365 E5, which includes Power BI Pro at no additional cost. The per-user economics become unbeatable when you already own the licenses.

Switch to Metabase when you need analytics up and running in under a day without procurement cycles. Self-hosted Metabase deploys with a single Docker command and connects to your existing database directly, no cloud warehouse required.

Switch to Looker when your data team needs strict metric governance and you want every dashboard to pull from a single source of truth defined in version-controlled LookML. This matters most in organizations where inconsistent metric definitions have caused trust issues.

Switch to Tableau when your analysts need visualization capabilities that go beyond what spreadsheet-style tools offer, particularly for geospatial analysis, statistical modeling, and complex multi-dimensional exploration.

Switch to Lightdash when your data stack is already built on dbt and you want your BI layer to inherit metric definitions, documentation, and lineage directly from your transformation layer without maintaining a separate semantic model.

Switch to Amazon QuickSight when your data infrastructure is AWS-native and you need pay-per-session pricing for a large base of occasional viewers who would otherwise inflate per-seat costs.

Migration Considerations

Moving away from Sigma means rethinking how your organization interacts with warehouse data. Sigma's spreadsheet interface is unique in the BI market; users accustomed to building analyses through cells, formulas, and pivots will face a learning curve with any alternative. Tableau and Power BI offer drag-and-drop canvas interfaces, while Looker and Lightdash require more involvement from data teams to build explores and dashboards.

Data compatibility is straightforward for most migrations since Sigma does not store your data. Your warehouse tables, views, and permissions remain intact regardless of which BI tool queries them. However, any Input Tables with writeback data, materialized views created through Sigma, and custom calculated fields will need to be recreated in the target tool or pushed back into your transformation layer.

Expect the steepest learning curve when moving to Looker, which requires LookML proficiency, or Lightdash, which assumes comfort with dbt. Metabase and QuickSight have the gentlest onboarding curves. Budget 2-4 weeks for a team of 10-20 users to reach productivity parity on Tableau or Power BI, and 4-8 weeks for Looker if your team has no prior LookML experience. Organizations using Sigma's embedded analytics via React SDK should evaluate each alternative's embedding capabilities carefully, as Metabase, Looker, and Power BI all offer embedded options but with different authentication models and customization depth.

What users say about Sigma Computing

Historical review enrichment from TrustRadius.

Pros

  • Easy to learn

Cons

  • Reports and dashboards

Public signals

About these signals

Verified factual signals from public sources. They indicate observable activity or interest, not total adoption, product quality, or cost.

0 GitHub commits 90d6 GitHub stars0 vulnerabilities across 1 package

See all signals from 6 sources
Source
Signals
Last updated
GitHub
Commits 90d:0Stars:6
September 21, 2026
npm
Weekly downloads:16.1k↑1.2k
September 21, 2026
Google Trends
Search interest:Top 53%overallTop 54%in Business Intelligence
September 21, 2026
Hacker News
Matching stories, 90d:0
September 21, 2026
Product Hunt
Comments:1Reviews:0Votes:6
September 21, 2026
OSV
Package vulnerabilities:0 vulnerabilitiesacross 1 package

npm · @sigmacomputing/embed-sdk@0.7.1

September 21, 2026
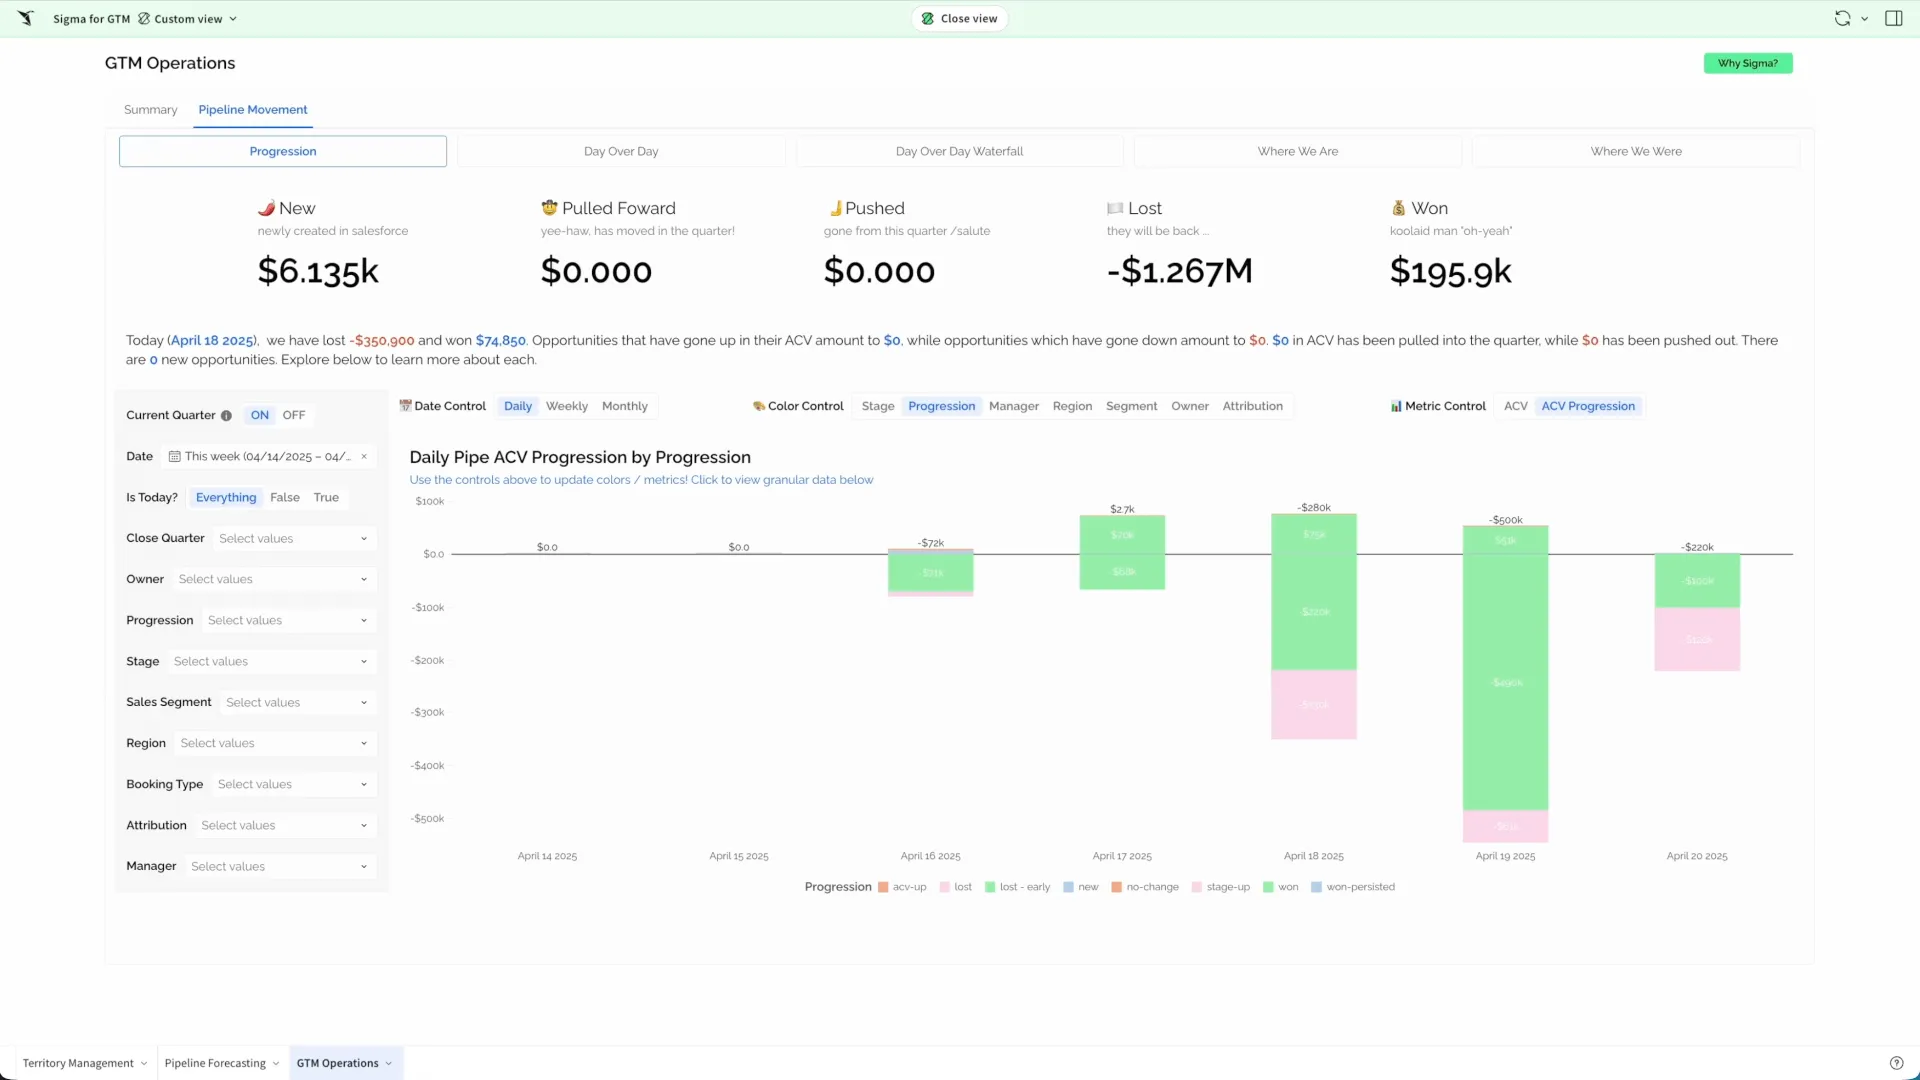
Sigma Computing product dashboard and interface

Frequently asked questions

What is Sigma Computing?

Sigma Computing is a cloud-native business intelligence tool that offers a spreadsheet-like interface for data teams, enabling them to easily analyze and visualize their data.

How much does Sigma Computing cost?

Pricing for Sigma Computing starts at $25.00 per month, with a freemium model available for smaller teams or projects.

Is Sigma Computing better than Tableau?

Sigma Computing offers a more cloud-native and scalable approach to business intelligence compared to traditional tools like Tableau, making it suitable for larger datasets and distributed teams.

Can I use Sigma Computing for data analysis on a small dataset?

Yes, Sigma Computing is designed to handle both large-scale and small-scale data sets, making it an excellent choice for projects of all sizes.

Does Sigma Computing have any limitations or drawbacks?

While Sigma Computing offers many benefits, it may require some time to get familiar with its unique interface and features. Additionally, larger teams might find the freemium pricing model limiting as their usage grows.

Related BI Platforms

Other BI platforms in the catalog. Same kind of product, not a substitution recommendation.