Decision comparison
Splunk vs Dynatrace
Splunk dominates in log analytics, SIEM, and security operations with unmatched data ingestion flexibility, while Dynatrace leads in automated full-stack APM with AI-driven root cause analysis and lower operational overhead.
Direct comparison. These are reviewed substitutes bought for the same job, so the differences below are the ones that decide between them.
These are different kinds of product — Log Management and Observability Platform.
Quick Comparison
| Decision factor | Splunk | Dynatrace |
|---|---|---|
| Ease of Use | Steep learning curve requiring SPL expertise; best suited for teams with dedicated administrators and analysts | AI-driven automation with OneAgent auto-discovery delivers faster time-to-value and lower manual configuration |
| Pricing | Splunk Free is a perpetual no-cost licence for a single self-hosted instance, capped at 500 MB of daily indexing and without alerting. Splunk Enterprise and Splunk Cloud use workload, ingest, or entity-based pricing that Splunk does not publish. | Dynatrace publishes a per-host rate card against a single annual platform commitment. Foundation & Discovery is $7 per month per host, Infrastructure Monitoring $29 per month per host, and Full-Stack Monitoring $58 per month per 8 GiB host, each also available at $0.01 per hour per host. Other capabilities draw down from the same commitment at published unit rates. There are no per-seat fees, and a 15-day free trial is offered. |
| Core Strength | Log search, SIEM, and security analytics across 2,000+ Splunkbase integrations with flexible data ingestion | Full-stack APM with automatic topology mapping, distributed tracing, and AI-powered root cause analysis |
| AI Capabilities | ML Toolkit with custom model development, outlier detection, predictive analytics, and clustering algorithms | Davis AI provides deterministic causal root cause analysis and anomaly detection without manual configuration |
| Scalability | SmartStore architecture scales compute and storage independently; supports massive data volumes at enterprise scale | Grail data lakehouse with indexless schema-on-read storage and massively parallel processing at scale |
| User Ratings | 8.6/10 from 542 reviews; praised for real-time data, query language, and custom dashboards | 8.4/10 from 617 reviews; praised for root cause analysis, user experience monitoring, and full-stack visibility |
Splunk
- Ease of Use:
- Steep learning curve requiring SPL expertise; best suited for teams with dedicated administrators and analysts
- Pricing:
- Splunk Free is a perpetual no-cost licence for a single self-hosted instance, capped at 500 MB of daily indexing and without alerting. Splunk Enterprise and Splunk Cloud use workload, ingest, or entity-based pricing that Splunk does not publish.
- Core Strength:
- Log search, SIEM, and security analytics across 2,000+ Splunkbase integrations with flexible data ingestion
- AI Capabilities:
- ML Toolkit with custom model development, outlier detection, predictive analytics, and clustering algorithms
- Scalability:
- SmartStore architecture scales compute and storage independently; supports massive data volumes at enterprise scale
- User Ratings:
- 8.6/10 from 542 reviews; praised for real-time data, query language, and custom dashboards
Dynatrace
- Ease of Use:
- AI-driven automation with OneAgent auto-discovery delivers faster time-to-value and lower manual configuration
- Pricing:
- Dynatrace publishes a per-host rate card against a single annual platform commitment. Foundation & Discovery is $7 per month per host, Infrastructure Monitoring $29 per month per host, and Full-Stack Monitoring $58 per month per 8 GiB host, each also available at $0.01 per hour per host. Other capabilities draw down from the same commitment at published unit rates. There are no per-seat fees, and a 15-day free trial is offered.
- Core Strength:
- Full-stack APM with automatic topology mapping, distributed tracing, and AI-powered root cause analysis
- AI Capabilities:
- Davis AI provides deterministic causal root cause analysis and anomaly detection without manual configuration
- Scalability:
- Grail data lakehouse with indexless schema-on-read storage and massively parallel processing at scale
- User Ratings:
- 8.4/10 from 617 reviews; praised for root cause analysis, user experience monitoring, and full-stack visibility
Public signals
Verified factual signals only. Bars appear only for like-for-like metrics with five weekly assessments for every tool; missing evidence stays explicit. These signals do not establish enterprise adoption, product quality, or total cost.
| Metric | Splunk | Dynatrace |
|---|---|---|
| Docker Hub pulls(Product adoption) | 93.2M | Not available |
| GitHub commits, 90d(Developer adoption) | 13 | 275 |
| GitHub stars(Developer adoption) | 741 | 220 |
| Search interest(Market interest) | 15 | 4 |
| Hacker News mentions, 90d(Community interest) | 2 | 4 |
| npm weekly downloads(Developer adoption) | 34.0k | Not available |
| Product Hunt comments(Community interest) | 0 | Not available |
| Product Hunt reviews(Community interest) | 0 | Not available |
| Product Hunt votes(Community interest) | 67 | Not available |
| PyPI weekly downloads(Developer adoption) | 285.4k | 20.2k |
| Stack Overflow questions(Community interest) | 2.3k | 199 |
As of September 14, 2026 — updated weekly.
Health & risk evidence
Observed public-source checks for mapped package versions and repositories.
Splunk
September 14, 2026Package vulnerabilities
npm · splunk-logging@0.11.1 · PyPI · splunk-sdk@3.0.1
0 vulnerabilities
across 2 packages
Repository security score
github.com/splunk/splunk-sdk-python
6.9/10
Dynatrace
September 14, 2026Package vulnerabilities
PyPI · oneagent-sdk@1.5.2.20260107.153442
0 vulnerabilities
across 1 package
Repository security score
Not available
Interface Preview
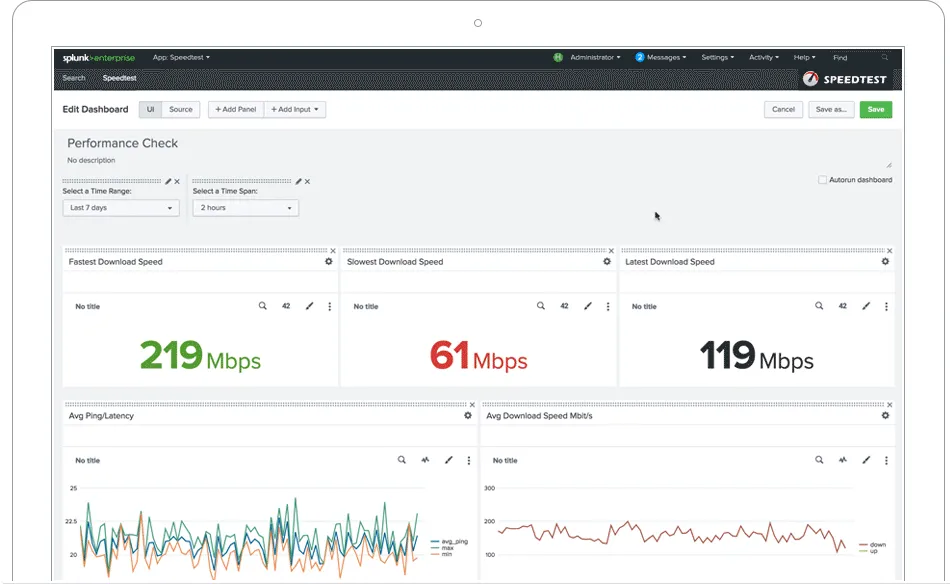
Splunk
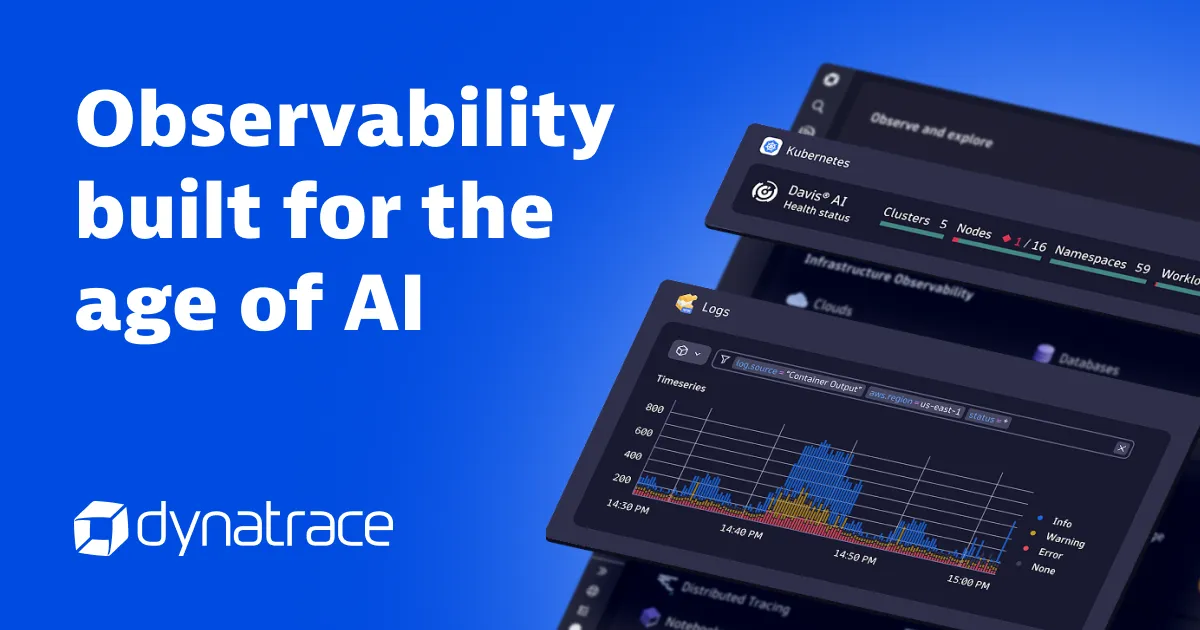
Dynatrace
Feature Comparison
| Feature | Splunk | Dynatrace |
|---|---|---|
| Core Observability | ||
| Application Performance Monitoring | Splunk APM provides distributed tracing, real-time code-level visibility, and AI assistants for troubleshooting across the full stack | Dynatrace delivers APM with PurePath distributed tracing, automatic code-level profiling, and topology-aware analysis for cloud-native and enterprise stacks |
| Infrastructure Monitoring | Monitors any environment and stack including AI infrastructure with business-impact-based issue prioritization and 2,000+ Splunkbase integrations | Provides end-to-end infrastructure observability for multi-cloud environments with automatic Smartscape topology mapping and real-time dependency visualization |
| Log Management | Core platform capability using SPL query language to search, index, and correlate real-time log data from any source at massive scale | Log Analytics module delivers intelligent analytics from log data with Grail data lakehouse for indexless, schema-on-read storage and fast querying |
| AI and Automation | ||
| AI-Powered Analysis | Machine Learning Toolkit with pre-built analytics, custom model development, outlier detection, predictive analytics, and clustering algorithms | Davis AI engine provides deterministic causal root cause analysis, anomaly detection, and predictive insights without manual configuration |
| Automated Remediation | Custom alert actions trigger automated workflows including email notifications, remediation scripts, and integration with ITSM tools | Agentic operations system orchestrates built-in and third-party agents for autonomous prevention, remediation, and optimization driven by causal analysis |
| AIOps | IT Service Intelligence uses AI and ML to correlate data from multiple sources, reduce alert noise, and proactively predict outages | Earned top scores in Forrester Wave AIOps report with foundational agents enabling predictions, anomaly detection, and causal root cause for agentic action |
| Security | ||
| Threat Detection | Unified threat detection, investigation, and response with behavioral analytics, ML-based risk scoring, and advanced persistent threat identification | Threat Observability module provides advanced protection, automated response, and forensics with real-time vulnerability detection and prioritization |
| Compliance | Automates compliance monitoring for PCI, HIPAA, GDPR with streamlined audits, real-time security visibility, and specialized reporting | Enterprise-grade data privacy and compliance management with SOC2-aligned security controls built into the platform |
| SIEM Capabilities | Enterprise Security is a full-featured SIEM platform recognized as a consecutive leader in global analyst SIEM reports with 30% cost reduction vs legacy tools | Focuses on application security and vulnerability management rather than traditional SIEM; does not position as a standalone SIEM solution |
| Digital Experience | ||
| Real User Monitoring | Captures 8M+ traces and 50M+ spans with real-time visibility into user sessions and application performance metrics | Named a Leader in Gartner Magic Quadrant for DEM two years running with real-user monitoring, synthetic monitoring, and session replays |
| Synthetic Monitoring | Available through Splunk Observability Cloud with proactive monitoring of application endpoints and user workflows | Built-in synthetic monitoring runs scripted browser and API tests from global locations to detect issues before users are impacted |
| Business Analytics | Generates graphs, reports, alerts, dashboards, and visualizations with ODBC integration to Microsoft Excel and Tableau | Business Observability module enables real-time customizable analytics with business events and OpenPipeline for data-driven decision making |
| Platform and Integration | ||
| Data Ingestion | Ingests logs, metrics, traces, and events from 2,000+ sources via Splunkbase with built-in OpenTelemetry support, SDKs, and agents | OneAgent deploys once per host for automatic full-stack data collection; OpenPipeline handles stream processing to ingest and enrich data from any source |
| Extensibility | Splunkbase marketplace offers 2,000+ apps and add-ons with rich SDKs for custom integrations and embedded reporting in external applications | AppEngine enables custom app development leveraging observability and security data; expanding library of integrations and extensions beyond traditional observability |
| Deployment Options | Available as self-hosted Enterprise, Splunk Cloud Platform SaaS, or hybrid with SmartStore for flexible compute and storage scaling | Primarily SaaS-delivered with 15-day free trial; supports multi-cloud environments with automatic discovery and mapping via Smartscape technology |
Core Observability
Application Performance Monitoring
Infrastructure Monitoring
Log Management
AI and Automation
AI-Powered Analysis
Automated Remediation
AIOps
Security
Threat Detection
Compliance
SIEM Capabilities
Digital Experience
Real User Monitoring
Synthetic Monitoring
Business Analytics
Platform and Integration
Data Ingestion
Extensibility
Deployment Options
Which to choose
Splunk dominates in log analytics, SIEM, and security operations with unmatched data ingestion flexibility, while Dynatrace leads in automated full-stack APM with AI-driven root cause analysis and lower operational overhead.
Best-fit scenarios
Choose Splunk if:
Choose Splunk when your primary needs center on security operations, SIEM, and log analytics at enterprise scale. Splunk is the stronger choice for organizations that need to consolidate multiple security tools, run advanced threat detection with behavioral analytics, and maintain compliance across frameworks like PCI, HIPAA, and GDPR. Teams with dedicated Splunk administrators who can leverage SPL and the Machine Learning Toolkit will extract maximum value from the platform's 2,000+ integrations and flexible data ingestion.
Choose Dynatrace if:
Choose Dynatrace when your priority is application performance monitoring with automated root cause analysis and minimal manual configuration. Dynatrace is ideal for organizations running complex cloud-native architectures that need automatic topology discovery, AI-powered anomaly detection, and end-to-end distributed tracing without building custom queries. Teams that value faster time-to-value, lower administrative overhead, and a unified platform for APM, digital experience monitoring, and infrastructure observability will benefit most from Dynatrace's approach.
These scenarios reflect the available product evidence. Your requirements, existing stack, and team expertise should guide the final decision.
Frequently Asked Questions
How do Splunk and Dynatrace differ in their approach to AI and automation?
Splunk and Dynatrace take fundamentally different approaches to AI. Splunk provides a Machine Learning Toolkit that gives teams the building blocks to create custom models, run predictive analytics, and perform anomaly detection using guided assistants and open-source algorithms. This approach offers flexibility but requires hands-on configuration. Dynatrace uses its Davis AI engine to deliver deterministic causal root cause analysis automatically, without manual threshold setting or rule creation. Dynatrace's agentic operations system orchestrates autonomous remediation, while Splunk's AI focuses on surfacing insights that analysts then act upon.
What is the total cost of ownership for Splunk vs Dynatrace?
Small deployments ingesting 1-10 GB/day cost $1,800-$18,000 annually, while large deployments at 500+ GB/day range from $400,000-$800,000. Infrastructure and implementation add 30-50% to the base license. Dynatrace uses usage-based pricing starting at $7/month per host unit for infrastructure monitoring, with additional charges for APM, log analytics, and digital experience modules. Dynatrace emphasizes cost transparency with single-commit volume discounts and no penalties for exceeding commit levels.
Can Splunk and Dynatrace be used together in the same organization?
Many enterprises run Splunk and Dynatrace side by side, using each platform for its core strengths. A common deployment pattern pairs Splunk for SIEM, security analytics, and centralized log management with Dynatrace for application performance monitoring, infrastructure observability, and digital experience tracking. Both platforms support OpenTelemetry for data exchange, and Dynatrace data can be forwarded to Splunk for correlation with security events. This combined approach works well for organizations with separate security operations and DevOps teams that need specialized tooling for each function.
Which platform is better for cloud-native and microservices architectures?
Dynatrace holds an advantage for cloud-native monitoring thanks to its OneAgent automatic discovery and Smartscape topology mapping, which automatically identifies and maps interactions between microservices and infrastructure components without manual configuration. Splunk Observability Cloud also supports cloud-native environments with distributed tracing and APM, but requires more setup and configuration effort. For organizations running Kubernetes, serverless functions, and containerized workloads, Dynatrace's automatic instrumentation and real-time dependency mapping reduce the operational burden of maintaining observability across rapidly changing environments.