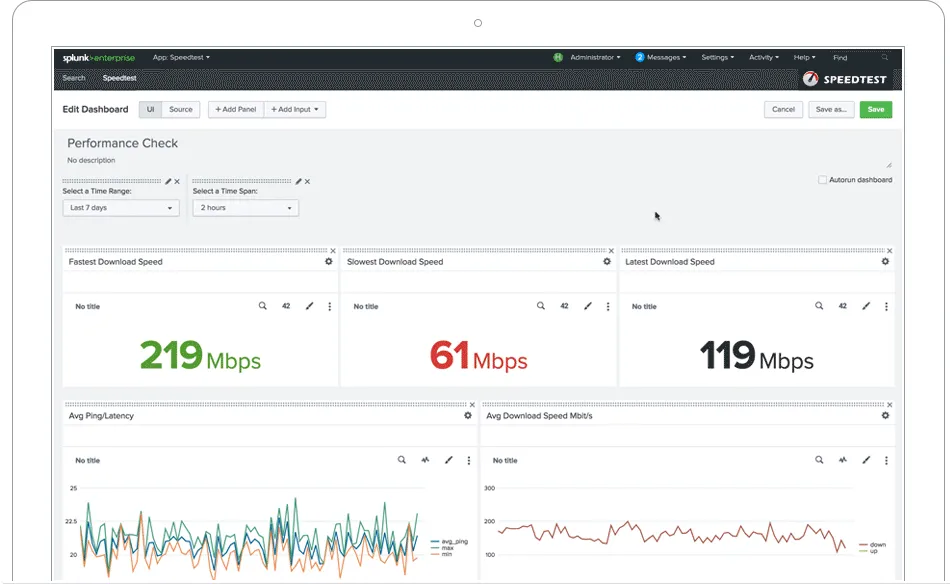
If you are evaluating Splunk alternatives, you are likely weighing factors like pricing predictability, deployment flexibility, and the breadth of observability coverage your team actually needs. Splunk has long been a dominant force in log management, SIEM, and enterprise observability, but its consumption-based pricing model and steep learning curve push many organizations to explore other options. Below is an honest look at the leading alternatives, how they compare architecturally, what they cost, and when a switch makes sense.
Top Alternatives Overview
Several mature platforms compete directly with Splunk across observability, log management, and security analytics. Here are the most notable alternatives worth evaluating.
Elastic Observability is built on the open-source Elastic Stack (formerly ELK Stack) and provides full-stack observability with log analytics, APM, infrastructure monitoring, and AIOps capabilities. It is standardized on OpenTelemetry and uses an AI Assistant for root cause analysis. Elastic is recognized as a Leader in the 2025 Gartner Magic Quadrant for Observability Platforms. Its open-source foundation gives teams the flexibility to self-host or use Elastic Cloud, and its Search AI Lake architecture supports petabyte-scale data retention with cost-efficient storage. User feedback highlights its ability to scale and strong community support, while noting the query language can have a learning curve.
Grafana Cloud offers a fully managed observability platform built on popular open-source projects including Grafana, Prometheus, Loki, and Tempo. It covers metrics, logs, traces, and profiling in a unified interface. Grafana Cloud emphasizes cost control through its Adaptive Telemetry feature, which automatically filters unused data to reduce spend. The platform supports OpenTelemetry natively and provides a free forever tier for personal projects and early-stage teams. Users praise its extensive data source integrations and alerting capabilities, with an 8.6/10 rating across 157 reviews.
Datadog is a SaaS-based observability and security platform that unifies infrastructure monitoring, APM, log management, real user monitoring, synthetic testing, and network monitoring. It integrates with hundreds of technologies out of the box and has been recognized as a Leader in both the Gartner Magic Quadrant for Observability Platforms and for Digital Experience Monitoring. Users note its powerful data capabilities and responsive customer support, while flagging a learning curve and noting that costs can grow with complex pricing across multiple product modules. It holds an 8.6/10 rating from 346 reviews.
Dynatrace positions itself as an AI-powered observability leader, offering automatic instrumentation, application performance monitoring, infrastructure monitoring, and security analytics. Its platform uses AI to prevent problems, automate workflows, and deliver actionable insights. Dynatrace is particularly strong in large enterprise environments that require deep, automated discovery across complex application stacks. It holds an 8.4/10 rating across 617 reviews.
New Relic provides an AI-powered observability platform that correlates telemetry across the full stack. It offers a usage-based pricing model with a free tier and charges based on data ingest volume and user seats. New Relic supports full-stack monitoring with APM, infrastructure monitoring, log management, and browser monitoring. It holds a 7.9/10 rating from 353 reviews.
Prometheus is the open-source monitoring standard for cloud-native environments. It uses a pull-based metrics collection model with PromQL as its query language, built-in alerting, and native Kubernetes service discovery. Prometheus has over 65,000 GitHub stars and serves as the metrics backbone for many organizations, often paired with Grafana for visualization. As a fully open-source and self-hosted solution, it requires operational investment but eliminates licensing costs entirely.
Architecture and Approach Comparison
The fundamental architectural difference between Splunk and its alternatives comes down to data ingestion philosophy, deployment models, and how each platform handles scale.
Data ingestion and storage. Splunk uses a schema-on-read approach, indexing machine data into a proprietary format optimized for fast search. This gives it flexibility to handle unstructured data but ties storage costs directly to ingest volume. Splunk's SmartStore feature separates compute from storage, placing inactive data in lower-cost remote storage while keeping active data in local cache. Elastic Observability takes a similar search-centric approach but leverages Elasticsearch as the underlying engine, offering logsdb index mode and TSDB for cost-efficient compression that can reduce the data footprint significantly. Grafana Cloud separates concerns by using Loki for logs (which indexes only labels, not full content), Mimir for metrics, and Tempo for traces, resulting in lower storage costs through a modular architecture. Datadog operates as a fully managed SaaS with proprietary storage, abstracting infrastructure concerns but limiting deployment flexibility. Prometheus stores time-series data locally on each server node, keeping individual instances autonomous and simple to operate.
Deployment flexibility. Splunk offers both self-hosted (Splunk Enterprise) and managed cloud (Splunk Cloud Platform) options. Elastic provides self-managed, hosted, and serverless deployment modes. Grafana Cloud is available as managed SaaS, and Grafana's open-source components can be self-hosted entirely. Datadog is cloud-only SaaS with no self-hosted option, which can be a blocker for organizations with strict data residency or compliance requirements. Prometheus is fully self-hosted and open source, giving complete control but requiring operational investment. Dynatrace offers both SaaS and managed deployment models.
Query languages and usability. Splunk uses SPL (Search Processing Language), a powerful but proprietary query language that user reviews consistently describe as having a steep learning curve. Elastic uses KQL and ES|QL for querying, the latter being a SQL-like language designed to lower the barrier for ad-hoc analysis. Grafana Cloud supports PromQL for metrics, LogQL for logs, and TraceQL for traces, all drawing from widely adopted open-source query standards. Datadog uses its own proprietary query syntax. Prometheus uses PromQL, which has become a de facto standard in the cloud-native monitoring ecosystem. New Relic uses NRQL, its own SQL-like query language.
OpenTelemetry support. Elastic Observability is fully standardized on OpenTelemetry and offers production-ready OTel distributions (EDOT). Grafana Cloud treats OpenTelemetry as a first-class protocol throughout its stack. Datadog supports OTel ingestion but also promotes its proprietary agents. Dynatrace supports OTel alongside its own OneAgent. New Relic accepts OTel data natively. Prometheus is a core part of the CNCF ecosystem alongside OpenTelemetry. Splunk supports OpenTelemetry through its platform with built-in support and SDKs, though its documentation and ecosystem still lean heavily toward proprietary forwarders.
Pricing Comparison
Pricing is often the primary driver behind evaluating Splunk alternatives. Splunk's consumption-based model charges primarily by daily data ingest volume (GB/day), with enterprise deployments commonly requiring custom quotes.
Splunk offers a free tier with a 500 MB daily indexing limit but without authentication, alerting, or clustering capabilities. For production use, Splunk Enterprise requires licensing. Splunk offers four pricing approaches: a limited Free tier, Workload Pricing, Ingest Pricing, and Entity Pricing (the latter three all requiring custom sales quotes). Organizations should request custom quotes based on their specific data ingest volume, as pricing scales with GB/day of data indexed. Total costs extend beyond licensing to include infrastructure, implementation, and training.
Elastic Observability offers Standard (starting at $95/month), Platinum (starting at $125/month), and Enterprise (starting at $175/month) tiers for its hosted offering. Self-managed deployments use license-based pricing. A free trial is available, and the self-managed option includes open-source components.
Grafana Cloud provides a free forever tier at no cost. Its Pro tier starts at $19/month plus usage-based charges above the free tier, with 13 months metric retention and 30 days for logs, traces, and profiles. Enterprise plans require an annual spend commitment and include premium support, custom retention, and deployment flexibility.
Datadog uses a multi-dimensional pricing model that charges separately for infrastructure monitoring (per host), log ingestion (per GB), log indexing (per million events), APM (per host), and custom metrics. Datadog charges per host for infrastructure monitoring, per GB for log ingestion, and per host for APM, with each product module billed separately. This model can lead to unpredictable costs as infrastructure scales, particularly in Kubernetes environments with ephemeral containers. A free tier is available with limited capabilities.
Dynatrace uses usage-based pricing with components starting at $7/month for certain capabilities. Exact pricing requires contacting sales for a custom quote.
New Relic offers a free tier with 100 GB of data ingest per month. Paid plans charge per user seat (Standard at $49/user/month, Pro at $349/user/month according to published pricing data) plus data ingest charges beyond the free allowance.
Prometheus is completely free and open source. However, organizations need to account for infrastructure costs to run and maintain Prometheus servers, and many teams invest in managed Prometheus services or Grafana Cloud for long-term storage and high availability.
When to Consider Switching
Not every organization needs to move away from Splunk. The platform remains a strong choice for enterprises deeply invested in its SIEM capabilities, those with established SPL expertise, and organizations that need a unified security and observability platform under one vendor (now part of Cisco). However, several scenarios make exploring alternatives worthwhile.
Cost unpredictability is a recurring problem. If your data volumes are growing and your Splunk bills are scaling faster than your budget can absorb, platforms with different pricing models provide relief. Grafana Cloud's Adaptive Telemetry and free tier, New Relic's per-user pricing, or Prometheus's zero licensing cost can all provide more predictable economics depending on your situation.
Your team is adopting cloud-native and Kubernetes-first architectures. Prometheus and Grafana Cloud are purpose-built for cloud-native environments with native Kubernetes service discovery and deep container ecosystem support. If your infrastructure is moving in this direction, these tools align more naturally with your stack than Splunk's traditional agent-based approach.
You need deployment flexibility that Splunk does not offer. If data residency, compliance mandates, or air-gapped environments are requirements, fully self-hosted options like Elastic Observability, Prometheus, or Grafana's open-source stack give you complete control over where your data lives and how it is managed.
Vendor lock-in is a strategic concern. Splunk's proprietary SPL query language and data formats make migration costly once you are deeply invested. If avoiding long-term lock-in is a priority, platforms built on open standards (OpenTelemetry, PromQL, open-source foundations) provide more portability and reduce switching costs.
You primarily need observability rather than SIEM. If your use case is application performance monitoring, infrastructure monitoring, and log analytics without the full SIEM and security analytics suite, alternatives like Datadog, Dynatrace, Grafana Cloud, or New Relic deliver a more focused and cost-effective solution. Splunk Enterprise Security is a mature SIEM product, and paying for that capability when you do not need it inflates costs unnecessarily.
Migration Considerations
Moving away from Splunk requires careful planning around data migration, query translation, team retraining, and integration continuity.
SPL query translation. Organizations with extensive saved searches, dashboards, and alerts written in SPL face the most significant migration hurdle. SPL does not translate directly to PromQL, LogQL, ES|QL, or other query languages. Plan for a period of query rewriting and validation. Some vendors offer migration tooling or professional services to assist with this translation. Teams with fewer complex SPL queries will find the transition smoother, while enterprises with hundreds of dashboards and detection rules should allocate substantial effort for this phase.
Data format and retention. Splunk stores data in a proprietary indexed format. You cannot simply export Splunk indexes and import them into another platform. For historical data, consider running Splunk in read-only mode during a transition period while new data flows into the replacement platform. Define a cutover date and plan retention accordingly. Most observability data has a natural expiration window, so a parallel-run approach works well.
Integration ecosystem. Splunk has over 2,000 apps and add-ons available through Splunkbase. Before switching, audit which integrations your organization actually uses and verify that equivalent data collection methods exist on the target platform. Most modern observability platforms support OpenTelemetry collectors, which can serve as a universal data pipeline during and after migration, reducing dependency on vendor-specific agents.
Team skills and training. Splunk has a well-established certification and training ecosystem. Moving to a new platform means investing in training for your operations and security teams. Consider running a proof of concept with a small team before committing to a full migration. Elastic, Grafana, and Datadog all offer extensive documentation, community resources, and formal training programs.
Phased migration approach. Rather than a big-bang cutover, most organizations benefit from a phased approach. Start by sending duplicate data to both Splunk and the new platform using OpenTelemetry Collectors or Splunk Universal Forwarders configured with multiple outputs. Validate that dashboards and alerts produce equivalent results, then gradually shift primary operations to the new tool. This parallel-run period helps catch gaps before they become production issues.
Cost modeling before commitment. Before committing to any alternative, model your actual data volumes, user counts, and feature requirements against the new platform's pricing structure. Several alternatives offer free tiers or pricing calculators that let you test with real workloads before making a financial commitment. Factor in not just licensing but also infrastructure, training, and migration labor costs for a true total cost of ownership comparison.