Decision comparison
Elastic Observability vs Splunk
Choose Elastic Observability when OpenTelemetry ingestion, Elasticsearch-based search, AI-assisted root-cause analysis, and petabyte-scale log retention are central requirements. Choose Splunk when the organization prioritizes mature real-time machine-data analytics alongside unified security operations, governed pipelines, SmartStore, and workload controls.
Direct comparison. These are reviewed substitutes bought for the same job, so the differences below are the ones that decide between them.
Applies to: Choosing where logs and monitoring data are stored, searched and alerted on.
These are different kinds of product — Observability Platform and Log Management.
Quick Comparison
| Decision factor | Elastic Observability | Splunk |
|---|---|---|
| Best For | OpenTelemetry-centric teams needing unified logs, metrics, traces, infrastructure monitoring, AI troubleshooting, and long-term petabyte-scale searchable retention. | Enterprise teams that need real-time machine-data search, security operations, dashboards, reporting, governed data pipelines, and policy-based workload allocation. |
| Architecture | Open-source Elasticsearch-based platform with hosted, serverless, and self-managed deployment options; ingests OTel-compliant data through 450+ integrations. | Enterprise platform captures, indexes, and correlates machine data into a searchable repository, with SmartStore architecture and Workload Management controls. |
| Pricing Model | Standard: As low as $95/month, Platinum: As low as $125/month, Enterprise: As low as $175/month | Splunk Free is a perpetual no-cost licence for a single self-hosted instance, capped at 500 MB of daily indexing and without alerting. Splunk Enterprise and Splunk Cloud use workload, ingest, or entity-based pricing that Splunk does not publish. |
| Ease of Use | AI Assistant, zero-config anomaly detection, and integrations simplify investigation, although users report confusing workflows, query-language friction, and dashboard usability gaps. | Users cite real-time workflows and setup as strengths, but frequently report a steep learning curve, difficult concepts, and training needs. |
| Scalability | Elasticsearch supports petabyte retention, scalable search, and logsdb index mode claiming 65% footprint reduction for log-heavy observability workloads. | SmartStore provides next-generation scalable data management, while Workload Management applies policies to allocate platform resources across concurrent workloads. |
| Community/Support | Open-source foundation and community support are reported strengths; Elastic Agent repository has 271 stars, Go primary language, and recent v9.5.2 release. | Broad user-feedback base includes 542 reviews with an 8.6/10 rating; Splunk Python SDK repository has 741 stars and Apache-2.0 license. |
Elastic Observability
- Best For:
- OpenTelemetry-centric teams needing unified logs, metrics, traces, infrastructure monitoring, AI troubleshooting, and long-term petabyte-scale searchable retention.
- Architecture:
- Open-source Elasticsearch-based platform with hosted, serverless, and self-managed deployment options; ingests OTel-compliant data through 450+ integrations.
- Pricing Model:
- Standard: As low as $95/month, Platinum: As low as $125/month, Enterprise: As low as $175/month
- Ease of Use:
- AI Assistant, zero-config anomaly detection, and integrations simplify investigation, although users report confusing workflows, query-language friction, and dashboard usability gaps.
- Scalability:
- Elasticsearch supports petabyte retention, scalable search, and logsdb index mode claiming 65% footprint reduction for log-heavy observability workloads.
- Community/Support:
- Open-source foundation and community support are reported strengths; Elastic Agent repository has 271 stars, Go primary language, and recent v9.5.2 release.
Splunk
- Best For:
- Enterprise teams that need real-time machine-data search, security operations, dashboards, reporting, governed data pipelines, and policy-based workload allocation.
- Architecture:
- Enterprise platform captures, indexes, and correlates machine data into a searchable repository, with SmartStore architecture and Workload Management controls.
- Pricing Model:
- Splunk Free is a perpetual no-cost licence for a single self-hosted instance, capped at 500 MB of daily indexing and without alerting. Splunk Enterprise and Splunk Cloud use workload, ingest, or entity-based pricing that Splunk does not publish.
- Ease of Use:
- Users cite real-time workflows and setup as strengths, but frequently report a steep learning curve, difficult concepts, and training needs.
- Scalability:
- SmartStore provides next-generation scalable data management, while Workload Management applies policies to allocate platform resources across concurrent workloads.
- Community/Support:
- Broad user-feedback base includes 542 reviews with an 8.6/10 rating; Splunk Python SDK repository has 741 stars and Apache-2.0 license.
Public signals
Verified factual signals only. Bars appear only for like-for-like metrics with five weekly assessments for every tool; missing evidence stays explicit. These signals do not establish enterprise adoption, product quality, or total cost.
| Metric | Elastic Observability | Splunk |
|---|---|---|
| GitHub commits, 90d(Developer adoption) | 423 | 13 |
| GitHub stars(Developer adoption) | 271 | 741 |
| Search interest(Market interest) | 0 | 15 |
| Hacker News mentions, 90d(Community interest) | 0 | 2 |
| Stack Overflow questions(Community interest) | 3.7k | 2.3k |
| Docker Hub pulls(Product adoption) | Not available | 93.2M |
| npm weekly downloads(Developer adoption) | Not available | 34.0k |
| Product Hunt comments(Community interest) | Not available | 0 |
| Product Hunt reviews(Community interest) | Not available | 0 |
| Product Hunt votes(Community interest) | Not available | 67 |
| PyPI weekly downloads(Developer adoption) | Not available | 285.4k |
As of September 14, 2026 — updated weekly.
Health & risk evidence
Observed public-source checks for mapped package versions and repositories.
Elastic Observability
Package vulnerabilities
Not available
Repository security score
Not available
Splunk
September 14, 2026Package vulnerabilities
npm · splunk-logging@0.11.1 · PyPI · splunk-sdk@3.0.1
0 vulnerabilities
across 2 packages
Repository security score
github.com/splunk/splunk-sdk-python
6.9/10
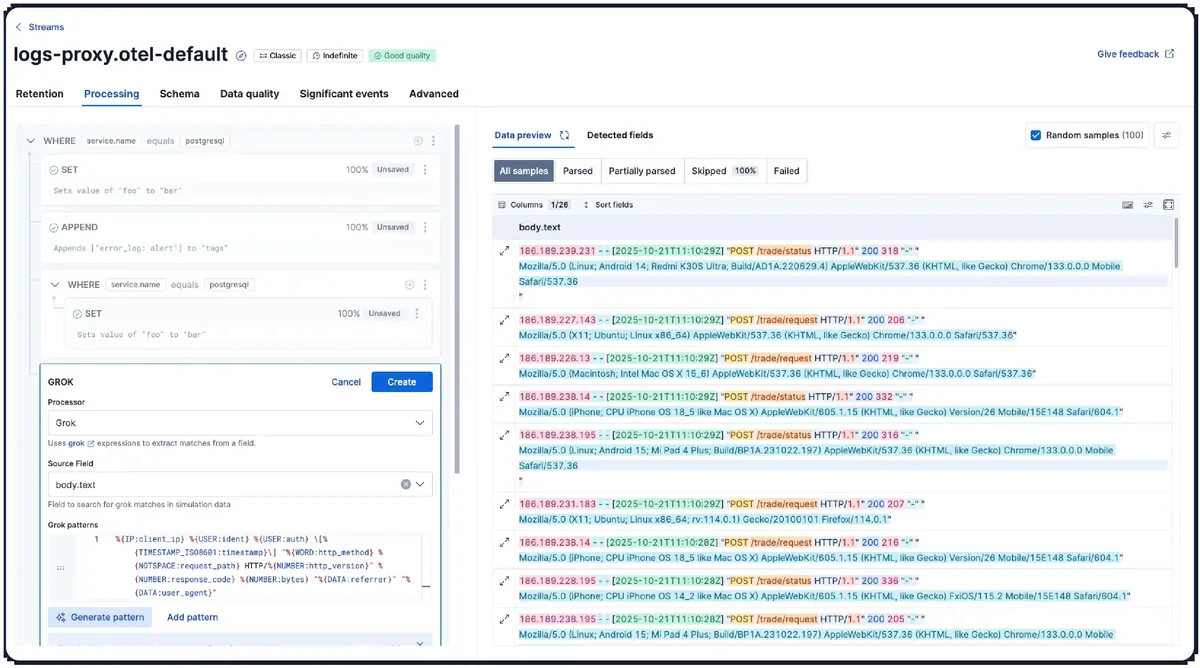
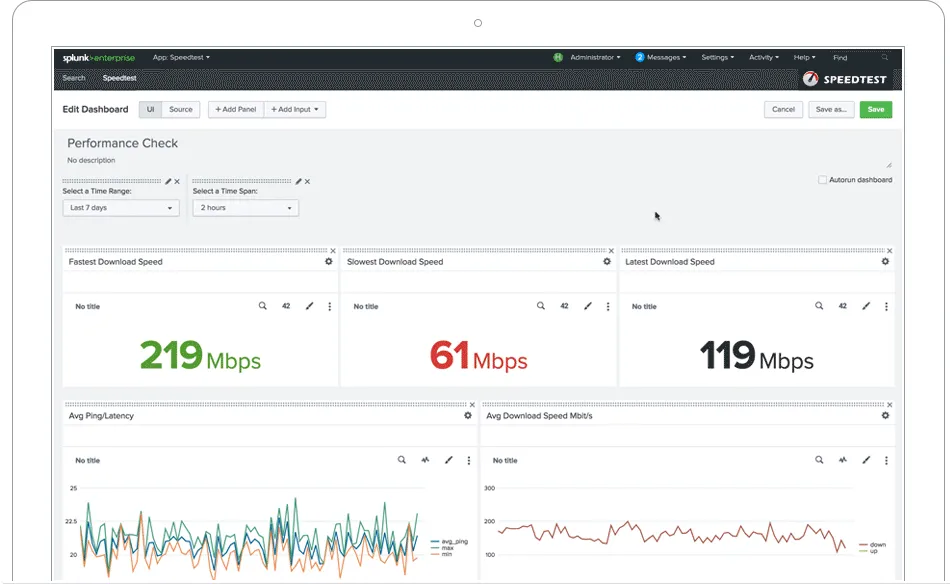
Interface Preview
Elastic Observability
Splunk
Feature Comparison
| Feature | Elastic Observability | Splunk |
|---|---|---|
| Data ingestion and storage | ||
| Data ingestion | OTel-compliant ingestion through 450-plus integrations | Captures and indexes real-time machine-generated data |
| Infrastructure coverage | 400-plus integrations across cloud, Kubernetes, on-prem, and serverless | Ingests machine data from any source at scale |
| Storage architecture | Search AI Lake combines data-lake storage and Elasticsearch search | SmartStore architecture manages scalable enterprise data storage |
| Search and analysis | ||
| Search engine | Low-latency Elasticsearch search with AI relevance capabilities | Searchable repository correlates indexed machine data |
| Querying | Elasticsearch query capabilities for logs and observability data | Dedicated query language analyzes machine-generated big data |
| Reporting and visualization | Instant dashboards support observability insights and investigations | Custom dashboards, graphs, reports, alerts, and visualizations |
| AI and operational intelligence | ||
| Anomaly detection | Zero-config ML detects anomalies and analyzes patterns | Real-time analytics and reporting expose operational data patterns |
| Root-cause investigation | AI Assistant provides context-aware natural-language root-cause analysis | Search and correlation investigate indexed operational events |
| LLM observability | Tracks LLM latency, errors, prompts, and costs | AI-native platform searches, analyzes, and acts on machine data |
| Enterprise operations | ||
| Deployment options | Available as hosted, serverless, or self-managed deployments | Splunk Free supports a single self-hosted instance at no cost; Enterprise is commercial |
| Capacity management | Logsdb index mode reduces log-storage footprint by 65% | Workload Management allocates resources through policy controls |
| Security operations | Observability focuses on application and infrastructure operational data | Unified platform includes threat detection and response capabilities |
| User experience and ecosystem | ||
| User feedback strengths | Users praise open source, scaling, search, data volume, and community | Users praise real-time data, setup, analytics, queries, and data sources |
| User feedback challenges | Users report confusing UX, query language, dashboard, and mobile limitations | Users report steep learning curve, complexity, and training requirements |
| Public repository evidence | Elastic Agent: 271 stars, Go, NOASSERTION, v9.5.2 | Splunk Python SDK: 741 stars, Python, Apache-2.0, v3.0.0 |
Data ingestion and storage
Data ingestion
Infrastructure coverage
Storage architecture
Search and analysis
Search engine
Querying
Reporting and visualization
AI and operational intelligence
Anomaly detection
Root-cause investigation
LLM observability
Enterprise operations
Deployment options
Capacity management
Security operations
User experience and ecosystem
User feedback strengths
User feedback challenges
Public repository evidence
Which to choose
Choose Elastic Observability when OpenTelemetry ingestion, Elasticsearch-based search, AI-assisted root-cause analysis, and petabyte-scale log retention are central requirements. Choose Splunk when the organization prioritizes mature real-time machine-data analytics alongside unified security operations, governed pipelines, SmartStore, and workload controls.
Best-fit scenarios
Choose Elastic Observability if:
Choose it for teams standardizing on OpenTelemetry, operating Kubernetes or mixed cloud/on-prem environments, retaining very large log volumes, or monitoring LLM workloads with prompt, latency, error, and cost telemetry.
Choose Splunk if:
Choose it for enterprises combining observability with security-team workflows, real-time machine-data investigation, custom reporting, SmartStore-based data management, and policy-based resource governance.
These scenarios reflect the available product evidence. Your requirements, existing stack, and team expertise should guide the final decision.
Frequently Asked Questions
What is the main difference between Elastic Observability and Splunk?
Elastic Observability is built around Elasticsearch, open-source roots, OpenTelemetry-compliant ingestion, and agentic AI workflows. Its provided capabilities emphasize 450-plus ingestion integrations, 400-plus infrastructure integrations, Search AI Lake, zero-config ML, and LLM telemetry. Splunk centers on capturing, indexing, searching, and correlating machine-generated data in a searchable repository, with dashboards, reporting, SmartStore, Workload Management, and unified security and observability positioning. The practical distinction is Elastic's OTel and Elasticsearch-led observability approach versus Splunk's enterprise machine-data, operations, and security platform approach.
Which is better for small teams?
For a small team comfortable with Elasticsearch and OpenTelemetry, Elastic Observability can be a strong fit when its Standard tier starting at $95/month aligns with budget and the team needs scalable logs, infrastructure monitoring, and AI-assisted investigation. Splunk offers the perpetual Splunk Free licence for self-hosted single-instance use, which can lower initial software cost, but users report a steep learning curve and training needs. Small teams should weigh Elastic's query and interface feedback against Splunk's operational complexity, hosting responsibility, expected data volume, and required security features.
Can I migrate from Elastic Observability to Splunk?
Yes, but this is a data-pipeline and workflow migration rather than a direct configuration transfer. Inventory Elastic data sources, retention rules, dashboards, alerts, queries, integrations, and any AI Assistant or LLM-observability workflows. Then map each source to Splunk collection and indexing, recreate searches and dashboards using Splunk's query language, and validate alert behavior and data volumes. OpenTelemetry-standardized ingestion may make source instrumentation easier to preserve, but Elasticsearch queries, logsdb storage settings, and Splunk dashboards require separate redesign and testing.
What are the pricing differences?
Elastic Observability publishes starting monthly prices: Standard from $95/month, Platinum from $125/month, and Enterprise from $175/month. Elastic also offers hosted, serverless, and self-managed deployment choices. Splunk provides the perpetual Splunk Free licence for self-hosted single-instance use and a custom-priced Enterprise offering. Its official pricing material lists prices including $15, $60, $75, $6, $33, $50, $13.75/month, $0.06/month, $12/month, $95/month, and $5 across plans, with free-trial, per-seat, usage-based, and sales-quote models. Confirm the relevant Splunk product, deployment, usage metric, and contract terms before comparing totals.