Decision comparison
Elastic Observability vs Uptrace
This is a comparison of scale of commitment more than of capability. Elastic Observability brings the Elasticsearch stack, with strong full-text log search and the option of serving search and security analytics from the same cluster — and the operational weight that comes with it. Uptrace is a small OpenTelemetry backend that one engineer can run alongside other work. Both are self-hostable and both do the three signals.
Architecture choice. These take different approaches to the same problem. Read the table as a fit question rather than a feature race.
Applies to: for teams that specifically value Elastic’s open-source observability positioning and agentic-AI messaging, while Uptrace is more explicit about OpenTelemetry-native ingestion and ClickHouse-based processing.
All 2 are observability platforms.
Quick Comparison
| Decision factor | Elastic Observability | Uptrace |
|---|---|---|
| What it is | Observability on the Elasticsearch stack, shared with search and security workloads | A compact open-source OpenTelemetry backend, narrow by design |
| Operational weight | A full Elasticsearch cluster: shard sizing, index lifecycle management and heap tuning | One service plus a datastore, runnable by a team without a platform group |
| Language coverage | Elastic APM agents and OpenTelemetry for Java, Python, Node.js, Go and .NET | OpenTelemetry SDKs for Java, Python, Node.js, Go and .NET; OTLP in, nothing proprietary |
| Deployment | Self-hosted on Docker or Kubernetes, or Elastic Cloud on AWS, GCP and Azure | Self-hosted on Docker or Kubernetes anywhere, or Uptrace Cloud |
| Log search | Full-text search across logs is a core strength of the inverted index | Log search sufficient for OpenTelemetry log data, without a text-search engine behind it |
| Scope beyond telemetry | Enterprise search and security analytics on the same cluster | None; the tool does telemetry and stops |
| Best fit | Organisations already invested in Elasticsearch or needing several workloads on one stack | Small teams already on OpenTelemetry wanting the lightest viable backend |
Elastic Observability
- What it is:
- Observability on the Elasticsearch stack, shared with search and security workloads
- Operational weight:
- A full Elasticsearch cluster: shard sizing, index lifecycle management and heap tuning
- Language coverage:
- Elastic APM agents and OpenTelemetry for Java, Python, Node.js, Go and .NET
- Deployment:
- Self-hosted on Docker or Kubernetes, or Elastic Cloud on AWS, GCP and Azure
- Log search:
- Full-text search across logs is a core strength of the inverted index
- Scope beyond telemetry:
- Enterprise search and security analytics on the same cluster
- Best fit:
- Organisations already invested in Elasticsearch or needing several workloads on one stack
Uptrace
- What it is:
- A compact open-source OpenTelemetry backend, narrow by design
- Operational weight:
- One service plus a datastore, runnable by a team without a platform group
- Language coverage:
- OpenTelemetry SDKs for Java, Python, Node.js, Go and .NET; OTLP in, nothing proprietary
- Deployment:
- Self-hosted on Docker or Kubernetes anywhere, or Uptrace Cloud
- Log search:
- Log search sufficient for OpenTelemetry log data, without a text-search engine behind it
- Scope beyond telemetry:
- None; the tool does telemetry and stops
- Best fit:
- Small teams already on OpenTelemetry wanting the lightest viable backend
Public signals
Verified factual signals only. Bars appear only for like-for-like metrics with five weekly assessments for every tool; missing evidence stays explicit. These signals do not establish enterprise adoption, product quality, or total cost.
| Metric | Elastic Observability | Uptrace |
|---|---|---|
| GitHub commits, 90d(Developer adoption) | 423 | Not available |
| GitHub stars(Developer adoption) | 271 | Not available |
| Search interest(Market interest) | 0 | 0 |
| Hacker News mentions, 90d(Community interest) | 0 | 0 |
| Stack Overflow questions(Community interest) | 3.7k | Not available |
| Docker Hub pulls(Product adoption) | Not available | 430.5k |
| GitHub commits, 90d(Product adoption) | Not available | 0 |
| GitHub stars(Product adoption) | Not available | 4,000+ |
| npm weekly downloads(Developer adoption) | Not available | 2.6k |
| PyPI weekly downloads(Developer adoption) | Not available | 17.6k |
As of September 14, 2026 — updated weekly.
Health & risk evidence
Observed public-source checks for mapped package versions and repositories.
Elastic Observability
Package vulnerabilities
Not available
Repository security score
Not available
Uptrace
September 14, 2026Package vulnerabilities
npm · @uptrace/node@2.3.0 · PyPI · uptrace@1.41.0
0 vulnerabilities
across 2 packages
Repository security score
Not available
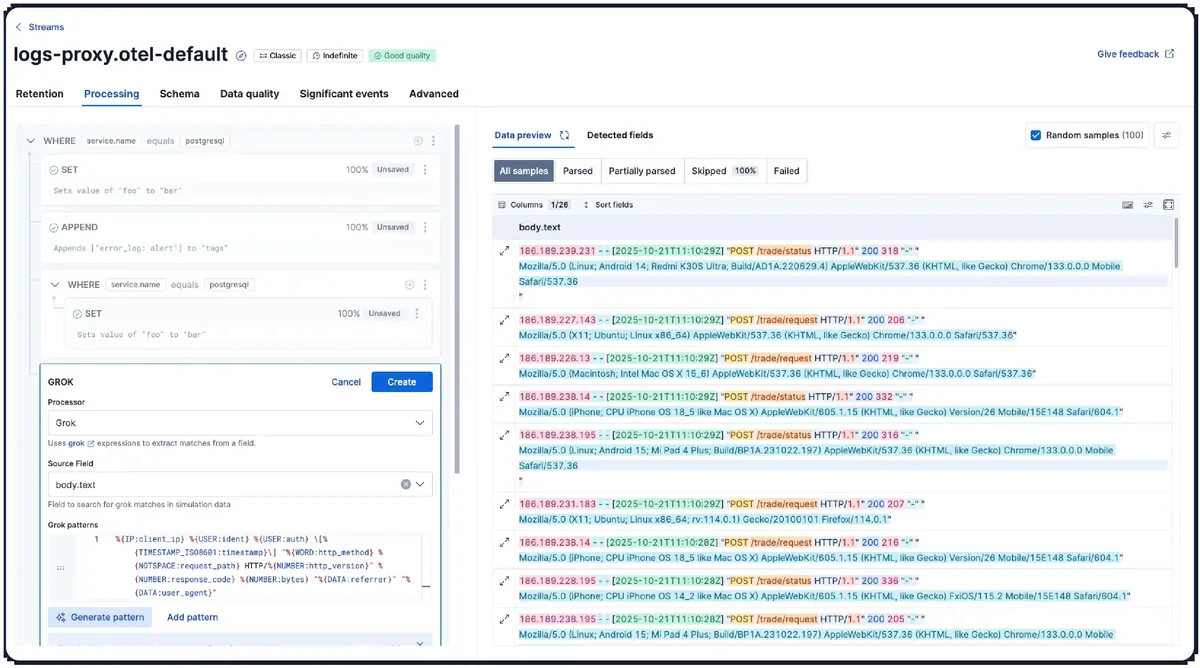
Interface Preview
Elastic Observability
Feature Comparison
| Feature | Elastic Observability | Uptrace |
|---|---|---|
| Telemetry | ||
| Distributed tracing | Full support | Full support |
| Metrics and dashboards | Full support | Full support |
| Log management | Full support | Full support |
| Full-text log search | Full support | Partial support |
| Platform | ||
| Shared stack with enterprise search | Full support | Not verified |
| Security analytics on the same data | Full support | Not verified |
| OpenTelemetry-native | Partial support | Full support |
| Alerting | Full support | Full support |
| Operations | ||
| Self-hosted deployment | Full support | Full support |
| Managed cloud option | Full support | Full support |
| Lightweight to run | Not verified | Full support |
| Data residency under your control | Full support | Full support |
| Commercial | ||
| Open-source licence | Partial support | Full support |
| Enterprise support | Full support | Partial support |
| Predictable cost at growing volume | Partial support | Full support |
| No per-user charging | Partial support | Full support |
Telemetry
Distributed tracing
Metrics and dashboards
Log management
Full-text log search
Platform
Shared stack with enterprise search
Security analytics on the same data
OpenTelemetry-native
Alerting
Operations
Self-hosted deployment
Managed cloud option
Lightweight to run
Data residency under your control
Commercial
Open-source licence
Enterprise support
Predictable cost at growing volume
No per-user charging
Which approach fits
This is a comparison of scale of commitment more than of capability. Elastic Observability brings the Elasticsearch stack, with strong full-text log search and the option of serving search and security analytics from the same cluster — and the operational weight that comes with it. Uptrace is a small OpenTelemetry backend that one engineer can run alongside other work. Both are self-hostable and both do the three signals.
When each approach fits
Choose Elastic Observability if:
Choose Elastic Observability when you already run Elasticsearch, or when search and security analytics belong on the same stack. The expertise and cluster you already have make observability a marginal addition rather than a new platform, and full-text log search across long retention is a capability a telemetry-only store does not match.
Choose Uptrace if:
Choose Uptrace when you want the lightest backend that covers traces, metrics and logs from OpenTelemetry. It is one service plus a datastore, which makes self-hosting realistic for a team that runs containers but has no platform engineers, and there is no per-user charge. Scope is the trade — no search platform, no security analytics, no integration catalogue.
These scenarios reflect the available product evidence. Your requirements, existing stack, and team expertise should guide the final decision.
Frequently Asked Questions
How heavy is Elasticsearch to run, honestly?
Heavier than most teams expect on first contact. Shard sizing, index lifecycle management, JVM heap tuning and cluster health monitoring are ongoing responsibilities, and a misconfigured cluster degrades in ways that take experience to diagnose. Teams that run it well usually have someone who knows it properly. If you already have that person, the weight is manageable; if you would be learning, factor that in.
Is Uptrace enough for a growing team?
For backend telemetry, generally yes — traces, metrics, logs and alerting from OpenTelemetry is what most teams use daily. The limits are scope rather than capacity: no real user monitoring, no integration catalogue, no security analytics. Those become reasons to move when you need them, and because instrumentation is OTLP, moving is a collector change rather than a rewrite.
Which is better for log-heavy workloads?
Elastic, if the work is searching logs rather than aggregating them. An inverted index is built for finding a rare string across large volumes, and index lifecycle management moves older data to cheaper tiers while keeping it searchable. Uptrace handles OpenTelemetry log data competently without a text-search engine behind it, which is fine for correlating logs to traces and less suited to forensic grepping.
Does OpenTelemetry make this reversible?
Yes, and it should shape the decision. Instrument with OTel and the backend is a collector configuration, so starting light and moving up costs dashboards and alerts rather than application changes. Given the operational asymmetry here, that argues for starting with the smaller system unless you already have Elasticsearch.
Can we use Elastic Cloud to avoid the operational cost?
Largely, yes — Elastic Cloud runs the cluster on AWS, GCP or Azure, which removes shard sizing and upgrades from your plate while keeping the capability. That changes the comparison from 'heavy versus light to operate' into a straight cost and scope question, which is a more even contest. It also removes the self-hosted data-residency advantage unless region selection is sufficient for your requirements.