Decision comparison
Acceldata vs DataBuck
Acceldata and DataBuck both stop bad data reaching users, and they cover different amounts of ground. Acceldata is a platform: data quality checks, pipeline monitoring and observability of the Spark, Databricks and warehouse compute underneath, including cost. DataBuck is narrower and faster to stand up, generating validation checks automatically from the data itself and scoring trust per table.
Direct comparison. These are reviewed substitutes bought for the same job, so the differences below are the ones that decide between them.
All 2 are data observability.
Quick Comparison
| Decision factor | Acceldata | DataBuck |
|---|---|---|
| What it is | A broad data observability platform covering data quality, pipelines and the compute infrastructure underneath | An automated data quality validation tool that generates and runs checks with little manual rule writing |
| Scope | Data reliability, pipeline monitoring, and Spark, Databricks and warehouse infrastructure performance and cost | Data quality and trust scoring on tables and files across warehouses, lakes and pipelines |
| How checks are created | Rules, profiling and anomaly detection, configured across the estate | Generated automatically from observed data, with manual rules added where needed |
| Infrastructure visibility | Compute, cluster and cost observability alongside data checks | Focused on the data itself rather than the platform running it |
| Typical buyer | Enterprise data platform teams running large Spark or Databricks estates | Teams that want validation running quickly without building a rule library |
| Integration surface | Warehouses, lakes, streaming, Spark, Databricks and orchestration | Warehouses, cloud object storage and common pipeline tools |
| Best fit | Organisations that want data and platform health in one place | Organisations whose main problem is unvalidated data arriving in volume |
Acceldata
- What it is:
- A broad data observability platform covering data quality, pipelines and the compute infrastructure underneath
- Scope:
- Data reliability, pipeline monitoring, and Spark, Databricks and warehouse infrastructure performance and cost
- How checks are created:
- Rules, profiling and anomaly detection, configured across the estate
- Infrastructure visibility:
- Compute, cluster and cost observability alongside data checks
- Typical buyer:
- Enterprise data platform teams running large Spark or Databricks estates
- Integration surface:
- Warehouses, lakes, streaming, Spark, Databricks and orchestration
- Best fit:
- Organisations that want data and platform health in one place
DataBuck
- What it is:
- An automated data quality validation tool that generates and runs checks with little manual rule writing
- Scope:
- Data quality and trust scoring on tables and files across warehouses, lakes and pipelines
- How checks are created:
- Generated automatically from observed data, with manual rules added where needed
- Infrastructure visibility:
- Focused on the data itself rather than the platform running it
- Typical buyer:
- Teams that want validation running quickly without building a rule library
- Integration surface:
- Warehouses, cloud object storage and common pipeline tools
- Best fit:
- Organisations whose main problem is unvalidated data arriving in volume
Public signals
Verified factual signals only. Bars appear only for like-for-like metrics with five weekly assessments for every tool; missing evidence stays explicit. These signals do not establish enterprise adoption, product quality, or total cost.
| Metric | Acceldata | DataBuck |
|---|---|---|
| Search interest(Market interest) | 0 | Unavailable |
| PyPI weekly downloads(Developer adoption) | 38.7k | Not available |
As of September 21, 2026 — updated weekly.
Health & risk evidence
Observed public-source checks for mapped package versions and repositories.
Acceldata
September 21, 2026Package vulnerabilities
PyPI · acceldata-sdk@26.9.0
0 vulnerabilities
across 1 package
Repository security score
Not available
DataBuck
Package vulnerabilities
Not available
Repository security score
Not available
Interface Preview
DataBuck
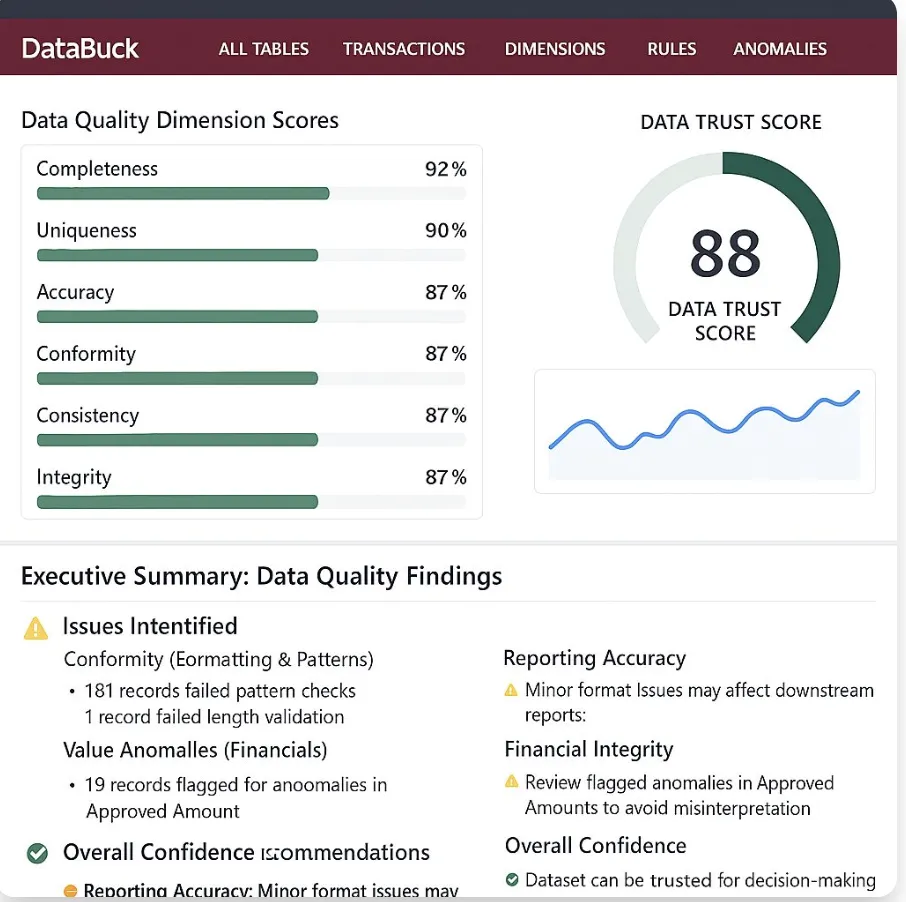
Feature Comparison
| Feature | Acceldata | DataBuck |
|---|---|---|
| Detection | ||
| Automatically generated checks | Full support | Full support |
| Manual rule authoring | Full support | Full support |
| Statistical anomaly detection | Full support | Full support |
| Schema change detection | Full support | Full support |
| Scope | ||
| Pipeline and job monitoring | Full support | Partial support |
| Spark and Databricks compute observability | Full support | Not verified |
| Warehouse cost visibility | Full support | Not verified |
| File and object storage validation | Full support | Full support |
| Operations | ||
| Slack and email alerting | Full support | Full support |
| REST API access | Full support | Full support |
| Orchestration integration | Full support | Full support |
| Data trust scoring | Partial support | Full support |
| Deployment | ||
| SaaS | Full support | Full support |
| Run in your own cloud account | Full support | Full support |
| On-premise | Full support | Partial support |
| Connects to Snowflake, BigQuery and Databricks | Full support | Full support |
Detection
Automatically generated checks
Manual rule authoring
Statistical anomaly detection
Schema change detection
Scope
Pipeline and job monitoring
Spark and Databricks compute observability
Warehouse cost visibility
File and object storage validation
Operations
Slack and email alerting
REST API access
Orchestration integration
Data trust scoring
Deployment
SaaS
Run in your own cloud account
On-premise
Connects to Snowflake, BigQuery and Databricks
Which to choose
Acceldata and DataBuck both stop bad data reaching users, and they cover different amounts of ground. Acceldata is a platform: data quality checks, pipeline monitoring and observability of the Spark, Databricks and warehouse compute underneath, including cost. DataBuck is narrower and faster to stand up, generating validation checks automatically from the data itself and scoring trust per table.
Best-fit scenarios
Choose Acceldata if:
Choose Acceldata when the problem is not only bad data but the platform producing it. Seeing a failing Spark job, the cluster it ran on, the cost it incurred and the table it corrupted in one place shortens investigations that otherwise cross three teams. That breadth suits large estates with dedicated platform engineering, where compute cost and pipeline reliability are already someone's responsibility.
Choose DataBuck if:
Choose DataBuck when the immediate problem is unvalidated data arriving faster than anyone can write rules for it. Checks are generated from observed data rather than authored by hand, so coverage across many tables arrives in days rather than quarters, and trust scores give a simple signal downstream consumers can act on.
These scenarios reflect the available product evidence. Your requirements, existing stack, and team expertise should guide the final decision.
Frequently Asked Questions
Do we need infrastructure observability as well as data quality?
Only if you run the infrastructure. An organisation on Snowflake or BigQuery with dbt doing transformation has little Spark or cluster health to watch, and Acceldata's breadth is capability you would pay for and not use. An organisation running large Databricks or Spark estates spends real time on job failures and cluster cost, and having that beside the data checks is a genuine saving.
How much rule writing does each require?
DataBuck's premise is that most of it should not be necessary: it profiles the data, derives expectations and flags deviations, with manual rules added where business logic demands them. Acceldata supports automatic profiling and anomaly detection too, but its configuration surface is larger because its scope is larger. Ask both vendors to run against your own tables and count how many useful checks exist after one week.
Which finds problems faster?
That depends on the kind of problem. Automated statistical checks catch volume drops, null spikes, distribution shifts and freshness failures quickly on both tools. Neither catches business logic errors where the data is statistically normal but semantically wrong — a currency conversion applied twice, a filter silently dropping a region. Those need rules you write, on either platform.
How do they fit with orchestration?
Both integrate with orchestration so checks can run as a pipeline step and block downstream tasks when they fail. That circuit-breaker pattern is usually more valuable than alerting after the fact, because it stops bad data propagating into dashboards and models rather than telling you afterwards that it did. Confirm the specific integration for your scheduler before committing.
What about cost visibility?
Acceldata includes warehouse and compute cost observability, which matters when Spark clusters or warehouse credits are a large line item and nobody can attribute them to teams or jobs. DataBuck does not cover that ground. If cost attribution is a live problem, it is a real point of difference; if finance already has it solved, it is not.
How should we roll one of these out?
Start with the tables that feed decisions someone would notice being wrong: the revenue model, the executive dashboard, the tables a machine learning feature depends on. Put monitoring on those first, tune the alerts until they are trusted, and route them to a Slack channel an on-call owner actually reads. Expanding to the whole warehouse before the alerts are trusted produces noise, and a noisy data quality tool gets muted within a month.