Decision comparison
Uptrace vs SigNoz
Choose Uptrace when predictable ingestion economics, a configurable monthly spending cap, OTel Arrow compression, or EU-based infrastructure are central requirements. Choose SigNoz when Apache 2.0 self-hosting, broad source ingestion, natural-language dashboard creation, and Kubernetes/Git/Jira debugging workflows matter most. Both use OpenTelemetry and ClickHouse to unify telemetry, so the primary decision is commercial control and workflow fit rather than telemetry scope.
Use-case winner
Choose Uptrace for cost predictability; choose SigNoz for ecosystem breadth
Both are OpenTelemetry-native observability tools. Uptrace is the cleaner fit when predictable ingestion pricing and EU-hosted simplicity matter most. SigNoz is stronger when you want a larger open-source community, hosted Teams plan, or broader migration story from Datadog.
Pick Uptrace when
you want low-friction OpenTelemetry, a generous free allowance, hard budget caps, and EU hosting.
Pick SigNoz when
you want a larger OSS footprint, managed cloud starting at a low monthly commitment, and Datadog migration positioning.
Avoid both when
you need a full enterprise observability suite with mature APM, logs, SIEM, and many packaged integrations.
Direct comparison. These are reviewed substitutes bought for the same job, so the differences below are the ones that decide between them.
All 2 are observability platforms.
Quick Comparison
| Decision factor | Uptrace | SigNoz |
|---|---|---|
| Best For | Cost-conscious teams needing OpenTelemetry-based APM, unified telemetry, predictable ingestion caps, and EU-based managed or self-hosted deployment. | Teams seeking an OpenTelemetry-native, self-hostable observability platform with correlated telemetry, ClickHouse storage, and AI-oriented workflow integrations. |
| Architecture | OpenTelemetry and ClickHouse platform unifying traces, metrics, and logs; supports managed cloud and self-hosted deployments. | OpenTelemetry-native platform using ClickHouse columnar storage, deployed as self-hosted Community Edition or managed SigNoz Cloud. |
| Pricing Model | Uptrace Cloud includes 50 GB free every month, then starts from $0.075/GB. Volume discounts apply automatically, with unlimited users, services, and hosts. Metrics are billed per million ingested datapoints. The supplied evidence does not list a public monthly starting price or per-seat price; buyers should evaluate expected data volume, retention, and metrics usage. | Community Edition is free and open source for self-hosting. SigNoz Cloud Teams is $49/month and includes $49 of ingestion credits, with logs and traces at $0.30/GB ingested on 15-day retention and metrics at $0.10 per million samples on 1-month retention. Enterprise starts at $4,000/month and is quote-based. A startup programme offers $19/month for the first 12 months. |
| Ease of Use | Single application-health dashboard, RED metrics, latency percentiles, service graph, and live demo reduce initial operational investigation effort. | Unified dashboards, correlated telemetry, 50+ ingestion sources, and natural-language dashboard queries streamline investigation and dashboard creation. |
| Scalability | Processes billions of spans on ClickHouse; compression and volume discounts support high telemetry volume while monthly budgets constrain spend. | ClickHouse columnar storage supports observability workloads; Cloud usage billing applies to ingested logs and metrics data volume. |
| Community/Support | AGPL-3.0 open-source project with 4,280 GitHub stars; managed and self-hosted options support different operating models. | Open-source project with 32,038 GitHub stars; Enterprise offers dedicated support, SSO, and extended retention under custom pricing. |
Uptrace
- Best For:
- Cost-conscious teams needing OpenTelemetry-based APM, unified telemetry, predictable ingestion caps, and EU-based managed or self-hosted deployment.
- Architecture:
- OpenTelemetry and ClickHouse platform unifying traces, metrics, and logs; supports managed cloud and self-hosted deployments.
- Pricing Model:
- Uptrace Cloud includes 50 GB free every month, then starts from $0.075/GB. Volume discounts apply automatically, with unlimited users, services, and hosts. Metrics are billed per million ingested datapoints. The supplied evidence does not list a public monthly starting price or per-seat price; buyers should evaluate expected data volume, retention, and metrics usage.
- Ease of Use:
- Single application-health dashboard, RED metrics, latency percentiles, service graph, and live demo reduce initial operational investigation effort.
- Scalability:
- Processes billions of spans on ClickHouse; compression and volume discounts support high telemetry volume while monthly budgets constrain spend.
- Community/Support:
- AGPL-3.0 open-source project with 4,280 GitHub stars; managed and self-hosted options support different operating models.
SigNoz
- Best For:
- Teams seeking an OpenTelemetry-native, self-hostable observability platform with correlated telemetry, ClickHouse storage, and AI-oriented workflow integrations.
- Architecture:
- OpenTelemetry-native platform using ClickHouse columnar storage, deployed as self-hosted Community Edition or managed SigNoz Cloud.
- Pricing Model:
- Community Edition is free and open source for self-hosting. SigNoz Cloud Teams is $49/month and includes $49 of ingestion credits, with logs and traces at $0.30/GB ingested on 15-day retention and metrics at $0.10 per million samples on 1-month retention. Enterprise starts at $4,000/month and is quote-based. A startup programme offers $19/month for the first 12 months.
- Ease of Use:
- Unified dashboards, correlated telemetry, 50+ ingestion sources, and natural-language dashboard queries streamline investigation and dashboard creation.
- Scalability:
- ClickHouse columnar storage supports observability workloads; Cloud usage billing applies to ingested logs and metrics data volume.
- Community/Support:
- Open-source project with 32,038 GitHub stars; Enterprise offers dedicated support, SSO, and extended retention under custom pricing.
Public signals
Verified factual signals only. Bars appear only for like-for-like metrics with five weekly assessments for every tool; missing evidence stays explicit. These signals do not establish enterprise adoption, product quality, or total cost.
| Metric | Uptrace | SigNoz |
|---|---|---|
| Docker Hub pulls(Product adoption) | 430.5k | 1.0M |
| GitHub commits, 90d(Product adoption) | 0 | 609 |
| GitHub stars(Product adoption) | 4,000+ | 32,000+ |
| Search interest(Market interest) | 0 | 1 |
| Hacker News mentions, 90d(Community interest) | 0 | 3 |
| npm weekly downloads(Developer adoption) | 2.6k | Not available |
| PyPI weekly downloads(Developer adoption) | 17.6k | Not available |
| Stack Overflow questions(Community interest) | Not available | 9 |
As of September 14, 2026 — updated weekly.
Health & risk evidence
Observed public-source checks for mapped package versions and repositories.
Uptrace
September 14, 2026Package vulnerabilities
npm · @uptrace/node@2.3.0 · PyPI · uptrace@1.41.0
0 vulnerabilities
across 2 packages
Repository security score
Not available
SigNoz
Package vulnerabilities
Not available
Repository security score
Not available
Interface Preview
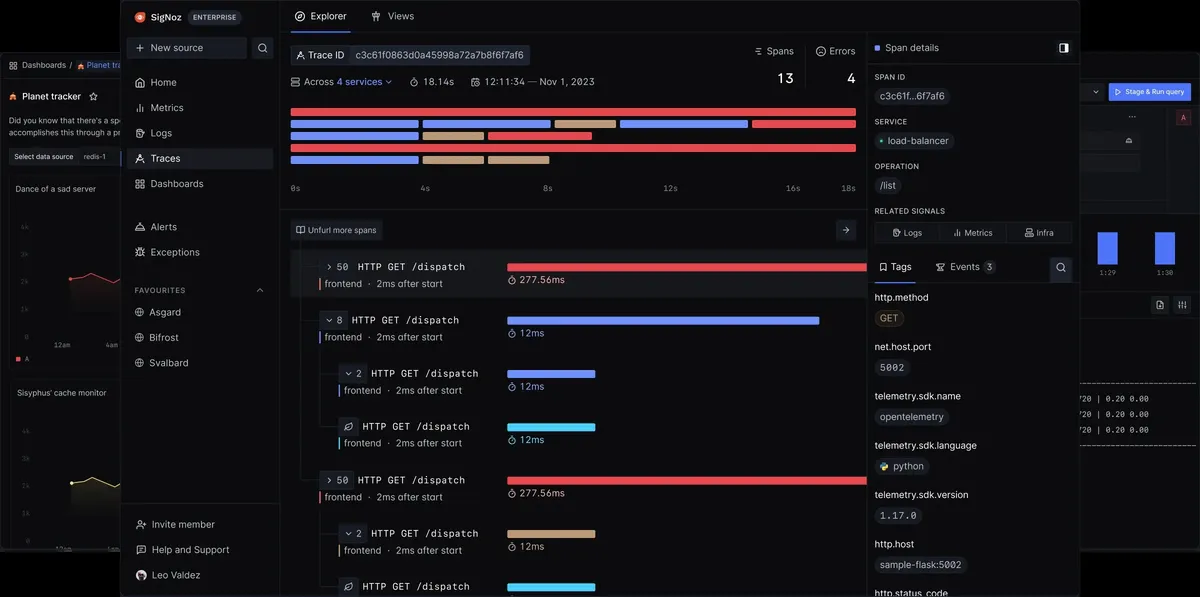
SigNoz
Feature Comparison
| Feature | Uptrace | SigNoz |
|---|---|---|
| Telemetry architecture | ||
| OpenTelemetry foundation | Built on OpenTelemetry for traces, metrics, and logs | OpenTelemetry-native platform using semantic conventions support |
| Primary storage approach | ClickHouse-backed unified observability data platform | ClickHouse columnar storage for observability data |
| Unified telemetry | Combines traces, metrics, and logs in one platform | Correlates traces, metrics, and logs in one platform |
| Ingestion and interoperability | ||
| Telemetry source ingestion | Ingests OpenTelemetry, Prometheus, Vector, FluentBit, and CloudWatch | Ingests observability data from more than 50 sources |
| Open standards positioning | Uses OpenTelemetry instrumentation and OTel Arrow protocol | Uses OpenTelemetry-native workflows without proprietary lock-in |
| Telemetry compression | OTel Arrow provides 15–30× compression for egress reduction | No specific telemetry compression mechanism stated in supplied data |
| Application investigation | ||
| Service dependency analysis | Service graph reveals dependencies and bottlenecks | End-to-end debugging integrates Kubernetes, Git, and Jira |
| APM health views | Dashboard shows RED metrics, percentiles, errors, and endpoints | Provides APM, distributed tracing, dashboards, errors, and alerts |
| Log analysis | Surfaces top errors and frequent log patterns | Correlates logs with metrics and traces for debugging |
| User experience and workflows | ||
| Dashboard creation | Single dashboard summarizes services, hosts, and systems | Natural-language query interface creates dashboards |
| Alerting | Includes alerting alongside APM, metrics, errors, and logs | Includes alerts within unified observability workflows |
| Live evaluation | Live demo is available without login | Free start requires no credit card |
| Deployment, governance, and commercial controls | ||
| Deployment model | Available as managed service or self-hosted deployment | Available as self-hosted Community Edition or cloud service |
| Cost controls | Monthly budget cap guarantees maximum usage charges | Usage-based Cloud billing charges for logs and metrics ingestion |
| Enterprise governance | EU-based infrastructure supports GDPR compliance by design | Enterprise plans offer SSO, dedicated support, extended retention |
Telemetry architecture
OpenTelemetry foundation
Primary storage approach
Unified telemetry
Ingestion and interoperability
Telemetry source ingestion
Open standards positioning
Telemetry compression
Application investigation
Service dependency analysis
APM health views
Log analysis
User experience and workflows
Dashboard creation
Alerting
Live evaluation
Deployment, governance, and commercial controls
Deployment model
Cost controls
Enterprise governance
Which to choose
Choose Uptrace when predictable ingestion economics, a configurable monthly spending cap, OTel Arrow compression, or EU-based infrastructure are central requirements. Choose SigNoz when Apache 2.0 self-hosting, broad source ingestion, natural-language dashboard creation, and Kubernetes/Git/Jira debugging workflows matter most. Both use OpenTelemetry and ClickHouse to unify telemetry, so the primary decision is commercial control and workflow fit rather than telemetry scope.
Best-fit scenarios
Choose Uptrace if:
Choose Uptrace for teams processing substantial span or log volume that need usage-based pricing from $0.075/GB, automatic volume discounts, budget ceilings, and a service-graph-centered APM experience.
Choose SigNoz if:
Choose SigNoz for teams that want a free Apache 2.0 self-hosted edition, an OpenTelemetry-native platform, 50+ ingestion sources, correlated debugging, and Cloud or Enterprise upgrade paths.
These scenarios reflect the available product evidence. Your requirements, existing stack, and team expertise should guide the final decision.
Frequently Asked Questions
What is the main difference between Uptrace and SigNoz?
Both platforms unify OpenTelemetry traces, metrics, and logs and use ClickHouse-oriented observability architectures. Uptrace emphasizes cost control: its Cloud service includes 50 GB free monthly, starts at $0.075/GB afterward, applies volume discounts, and lets customers set a hard monthly budget cap. SigNoz emphasizes open-source self-hosting and workflow breadth: its Apache 2.0 Community Edition is free to run yourself, while its platform includes correlated telemetry, natural-language dashboard querying, and Kubernetes, Git, and Jira integrations.
Which is better for small teams?
For a small team wanting minimal infrastructure ownership, Uptrace is compelling because the Cloud allowance includes 50 GB per month, unlimited users, services, and hosts, plus a no-login live demo and a spending cap. For a technically capable small team that prefers to operate its own platform, SigNoz Community Edition is free and Apache 2.0 licensed. SigNoz Cloud also offers a paid Teams plan at $49/month including $49 of ingestion credits, while its published Teams plan is $49/month and includes $49 of ingestion credits.
Can I migrate from Uptrace to SigNoz?
Migration is practical when telemetry is already instrumented with OpenTelemetry because both products accept OpenTelemetry data and unify traces, metrics, and logs. The work is primarily operational: redirect OpenTelemetry exporters or collectors, recreate dashboards and alerts, validate retention and sampling choices, and reconcile differing ingestion charges. Uptrace additionally lists Prometheus, Vector, FluentBit, and CloudWatch ingestion, while SigNoz states that it supports more than 50 sources, so source-by-source validation should precede a production cutover.
What are the pricing differences?
Uptrace Cloud includes 50 GB free each month and then starts at $0.075 per GB; metrics are billed per million ingested datapoints. It provides unlimited users, services, and hosts, automatic volume discounts, and a monthly budget cap. Its pricing page says billing occurs at month end or every $400, whichever comes first. SigNoz Community Edition is free and Apache 2.0 for self-hosting. SigNoz Cloud has a paid Teams plan at $49/month including $49 of ingestion credits, paid usage at $0.30 per GB for logs and metrics, a published $199 Teams plan, and custom-priced Enterprise plans.