Decision comparison
Grafana Cloud vs SigNoz
Grafana Cloud and SigNoz are both open-source-based observability with managed options, built on different architectures. Grafana Cloud runs purpose-built stores per signal — Mimir, Loki, Tempo — each with its own query language and a very large dashboard ecosystem. SigNoz keeps metrics, logs and traces in one ClickHouse-backed store behind a single query surface.
Direct comparison. These are reviewed substitutes bought for the same job, so the differences below are the ones that decide between them.
Applies to: Choosing between these two for the apm observability decision.
All 2 are observability platforms.
Quick Comparison
| Decision factor | Grafana Cloud | SigNoz |
|---|---|---|
| What it is | The managed LGTM stack — Loki for logs, Grafana for dashboards, Tempo for traces, Mimir for metrics — run as a service | An open-source, OpenTelemetry-native observability platform, self-hosted or run as a managed cloud service |
| Architecture | Purpose-built stores per signal: Mimir for metrics, Loki for logs, Tempo for traces | One ClickHouse-backed store for metrics, logs and traces together |
| Query languages | PromQL, LogQL and TraceQL, each matched to its store | A single query surface over one store, with SQL underneath |
| Deployment | Managed service, with the same components self-hostable | Self-hosted or SigNoz Cloud, from the same open-source project |
| Standards | OpenTelemetry and Prometheus exposition, both open | OpenTelemetry-native, with no proprietary agent |
| Ecosystem | Very large, with dashboards and plugins built over many years | Smaller and newer, focused on the OpenTelemetry path |
| Best fit | Teams already fluent in Prometheus and Grafana who want it operated | Teams who want one store, one query surface and the option to run it themselves |
| Instrumentation path | OpenTelemetry SDKs in Python, Java, Node.js or Go emitting OTLP, or the platform's own agent | OpenTelemetry SDKs in Python, Java, Node.js or Go emitting OTLP, or the platform's own agent |
Grafana Cloud
- What it is:
- The managed LGTM stack — Loki for logs, Grafana for dashboards, Tempo for traces, Mimir for metrics — run as a service
- Architecture:
- Purpose-built stores per signal: Mimir for metrics, Loki for logs, Tempo for traces
- Query languages:
- PromQL, LogQL and TraceQL, each matched to its store
- Deployment:
- Managed service, with the same components self-hostable
- Standards:
- OpenTelemetry and Prometheus exposition, both open
- Ecosystem:
- Very large, with dashboards and plugins built over many years
- Best fit:
- Teams already fluent in Prometheus and Grafana who want it operated
- Instrumentation path:
- OpenTelemetry SDKs in Python, Java, Node.js or Go emitting OTLP, or the platform's own agent
SigNoz
- What it is:
- An open-source, OpenTelemetry-native observability platform, self-hosted or run as a managed cloud service
- Architecture:
- One ClickHouse-backed store for metrics, logs and traces together
- Query languages:
- A single query surface over one store, with SQL underneath
- Deployment:
- Self-hosted or SigNoz Cloud, from the same open-source project
- Standards:
- OpenTelemetry-native, with no proprietary agent
- Ecosystem:
- Smaller and newer, focused on the OpenTelemetry path
- Best fit:
- Teams who want one store, one query surface and the option to run it themselves
- Instrumentation path:
- OpenTelemetry SDKs in Python, Java, Node.js or Go emitting OTLP, or the platform's own agent
Public signals
Verified factual signals only. Bars appear only for like-for-like metrics with five weekly assessments for every tool; missing evidence stays explicit. These signals do not establish enterprise adoption, product quality, or total cost.
| Metric | Grafana Cloud | SigNoz |
|---|---|---|
| GitHub commits, 90d(Developer adoption) | 244 | Not available |
| GitHub stars(Developer adoption) | 571 | Not available |
| Search interest(Market interest) | 1 | 1 |
| Hacker News mentions, 90d(Community interest) | 0 | 3 |
| Docker Hub pulls(Product adoption) | Not available | 1.0M |
| GitHub commits, 90d(Product adoption) | Not available | 609 |
| GitHub stars(Product adoption) | Not available | 32,000+ |
| Stack Overflow questions(Community interest) | Not available | 9 |
As of September 14, 2026 — updated weekly.
Interface Preview
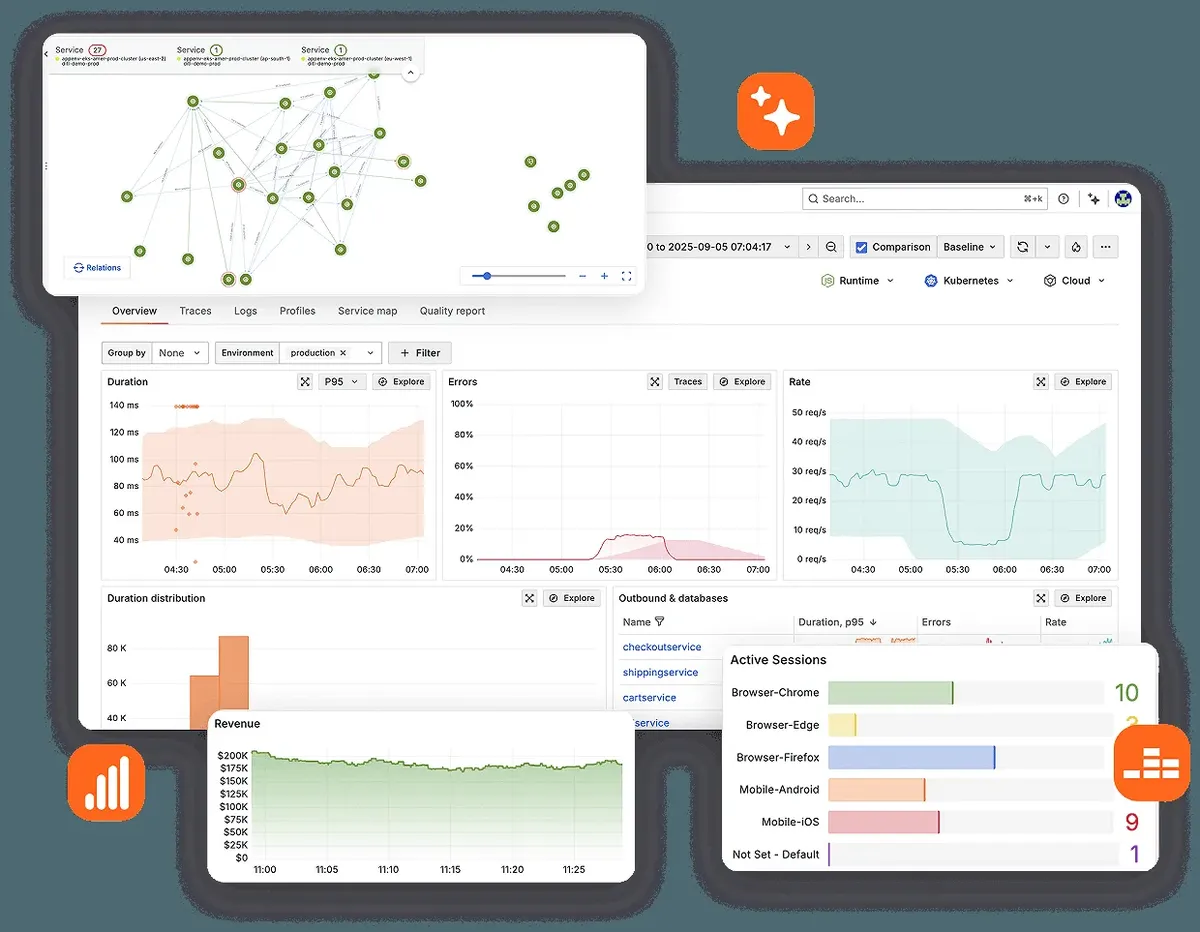
Grafana Cloud
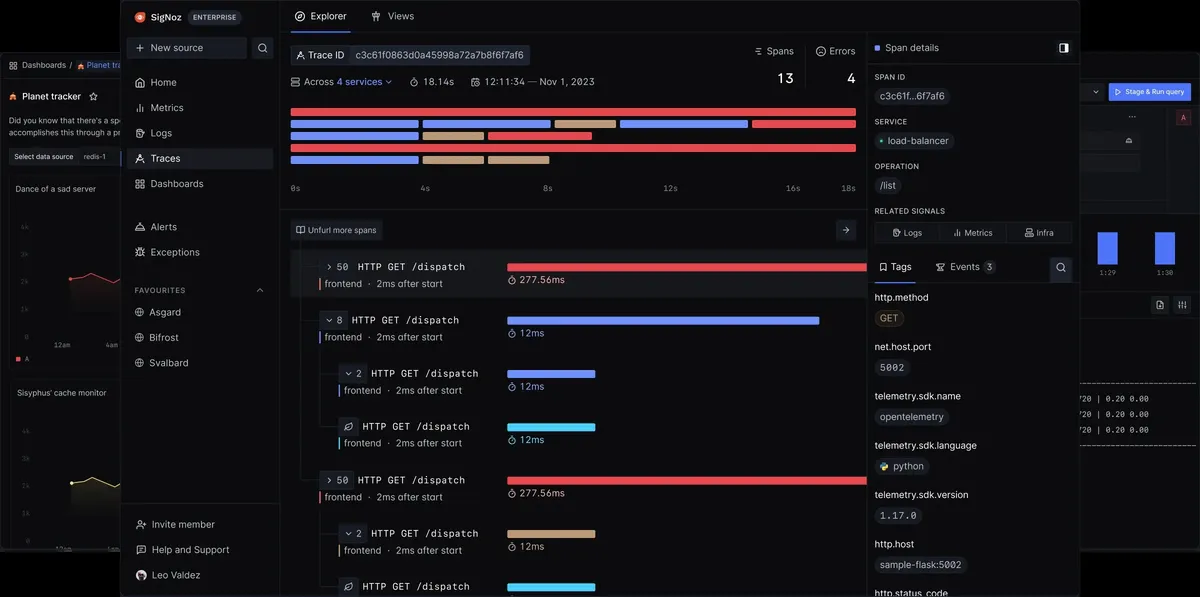
SigNoz
Feature Comparison
| Feature | Grafana Cloud | SigNoz |
|---|---|---|
| Architecture | ||
| Single store for all three signals | Not verified | Full support |
| Purpose-built store per signal | Full support | Not verified |
| Self-host the same software | Full support | Full support |
| Managed option from the project | Full support | Full support |
| Query | ||
| PromQL support | Full support | Partial support |
| Correlated traces, metrics and logs | Partial support | Full support |
| Exemplars linking metrics to traces | Full support | Full support |
| SQL access to telemetry | Not verified | Full support |
| Ecosystem | ||
| Large dashboard and plugin library | Full support | Partial support |
| Open source core | Full support | Full support |
| Usable free tier | Full support | Full support |
| Enterprise access control | Full support | Partial support |
| Standards | ||
| OpenTelemetry ingestion | Full support | Full support |
| Distributed tracing | Full support | Full support |
| Log search | Full support | Full support |
| Metrics dashboards and alerting | Full support | Full support |
Architecture
Single store for all three signals
Purpose-built store per signal
Self-host the same software
Managed option from the project
Query
PromQL support
Correlated traces, metrics and logs
Exemplars linking metrics to traces
SQL access to telemetry
Ecosystem
Large dashboard and plugin library
Open source core
Usable free tier
Enterprise access control
Standards
OpenTelemetry ingestion
Distributed tracing
Log search
Metrics dashboards and alerting
Which to choose
Grafana Cloud and SigNoz are both open-source-based observability with managed options, built on different architectures. Grafana Cloud runs purpose-built stores per signal — Mimir, Loki, Tempo — each with its own query language and a very large dashboard ecosystem. SigNoz keeps metrics, logs and traces in one ClickHouse-backed store behind a single query surface.
Best-fit scenarios
Choose Grafana Cloud if:
Choose Grafana Cloud when your team already thinks in Prometheus and Grafana. PromQL, LogQL and dashboards are known quantities, the plugin and dashboard library is large enough that most systems already have one, and purpose-built stores handle very high metric volumes economically.
Choose SigNoz if:
Choose SigNoz when one store and one query surface is worth more than per-signal optimisation. Correlating a trace with the logs and metrics around it is a join rather than a context switch between three query languages, and being OpenTelemetry-native means no proprietary agent and no translation layer.
These scenarios reflect the available product evidence. Your requirements, existing stack, and team expertise should guide the final decision.
Frequently Asked Questions
What does OpenTelemetry-native mean in practice?
That the product's data model is the standard's rather than a vendor's, so there is no translation layer and no proprietary agent to install. Instrumentation written for it works unchanged against any other OTLP backend, which is what makes the decision reversible. Vendor agents still collect some application detail that generic instrumentation does not, so check whether the depth you rely on comes from the standard before assuming a clean swap.
What does self-hosting actually cost?
Storage is cheap; the engineer is not. Running an observability backend at production scale means capacity planning, upgrades, cardinality management and an on-call rotation that understands the telemetry system as well as the systems it watches. For a team already operating Kubernetes with ClickHouse or similar underneath, it is an incremental workload on existing skills. For a team without that, it is a job nobody has time for — which is why the open option also sells a managed tier.
Does one store or three matter in practice?
It shows up during an incident. Three stores with three query languages means switching context to follow a trace into its logs, and the correlation depends on consistent labelling that somebody has to maintain. One store makes that a join. Against that, purpose-built stores handle very high volumes of their own signal more economically, so the trade is convenience against efficiency at scale.
What do these need to run?
An agent or an OpenTelemetry SDK in the application, and a destination. Services in Python, Java, Node.js or Go emit OTLP over HTTP or gRPC, and containers on Kubernetes are instrumented once per pod or once per node depending on the collector you choose. Nothing unusual is required on the application side; the operational weight sits in deciding what to sample, what to retain and for how long.
How portable is the instrumentation?
Both are properly portable, which makes this one of the more reversible decisions in the category. SigNoz is OpenTelemetry-native throughout. Grafana Cloud's components are the open-source projects themselves, so the same Mimir, Loki, Tempo and Pyroscope can run in your own cluster if the commercial relationship changes. What does not transfer is the querying idiom: PromQL and LogQL dashboards do not become ClickHouse queries by themselves, so budget for rebuilding saved queries rather than instrumentation.
What actually drives the cost on each?
On Grafana Cloud, four meters — metric series, log volume, trace volume and profiles — each with its own retention, and metric cardinality as the reliable overrun: one label carrying a user or request id multiplies series before anyone notices. On SigNoz self-hosted, no licence and a ClickHouse cluster whose cost grows with hardware rather than with telemetry sent, so retention is a disk decision. SigNoz Cloud converts that to an invoice. One rewards four dials well tuned, the other rewards being comfortable operating a database.
Who is each one for?
Grafana Cloud suits a platform team that already runs Prometheus and Grafana, wants per-signal retention control, and values the option of self-hosting the same components. SigNoz suits a team that wants one store where a trace, its logs and its metrics already sit together, without four retention policies to tune, and that is comfortable running ClickHouse or content to buy the hosted version. The question is whether per-signal control is a lever you will use or a set of dials you will leave alone.
How should we evaluate them?
Send a slice of real traffic to both and then debug a real incident on each. Dashboards demo well and tell you very little; what matters is whether an engineer at 3am can go from an alert to the cause without knowing in advance which dashboard to open. OpenTelemetry makes that trial cheap, because the instrumentation is the same and only the destination changes.